
Universal Infographic Studio
Topics to structured bilingual infographics
Universal Infographic Studio
Topics to structured bilingual infographics
Showcase
Description
Universal Infographic Studio turns a topic—or material you supply—into one clear, structured knowledge infographic. Give it a subject, or paste a document, article, or image you want explained; it returns a finished infographic image, the exact on-image text in copyable form, and the sources it used. It works in English and Chinese, follows the language of your topic, and defaults to a museum field-guide look in a single 3:4 poster with four to six knowledge modules. Figures such as percentages and rankings appear with their context, and every point is checked before it is drawn. When image generation is unavailable, you receive a complete render prompt instead. Turn a topic—or an article, document, or image you provide—into one clear, structured knowledge infographic. Give it a subject or source material, and you’ll receive a finished infographic, the on-image text in copyable form, and the sources actually used. It supports English and Chinese, follows the topic’s language by default, and uses a Museum field-guide style in a single 3:4 image with four to six knowledge modules. Percentages, rankings, and other figures are labeled with their context, and every point is checked before drawing. If image generation is unavailable, it returns a complete render prompt. AI-generated text, data, and illustrations should be reviewed before publication. AI-generated text, data, and illustrations still require human review before publication.
Recommended by
淡苍
Why we love this skill
Creates readable bilingual infographics with fact-checking, contextualized data, and original editorial design.
Related Skills
View all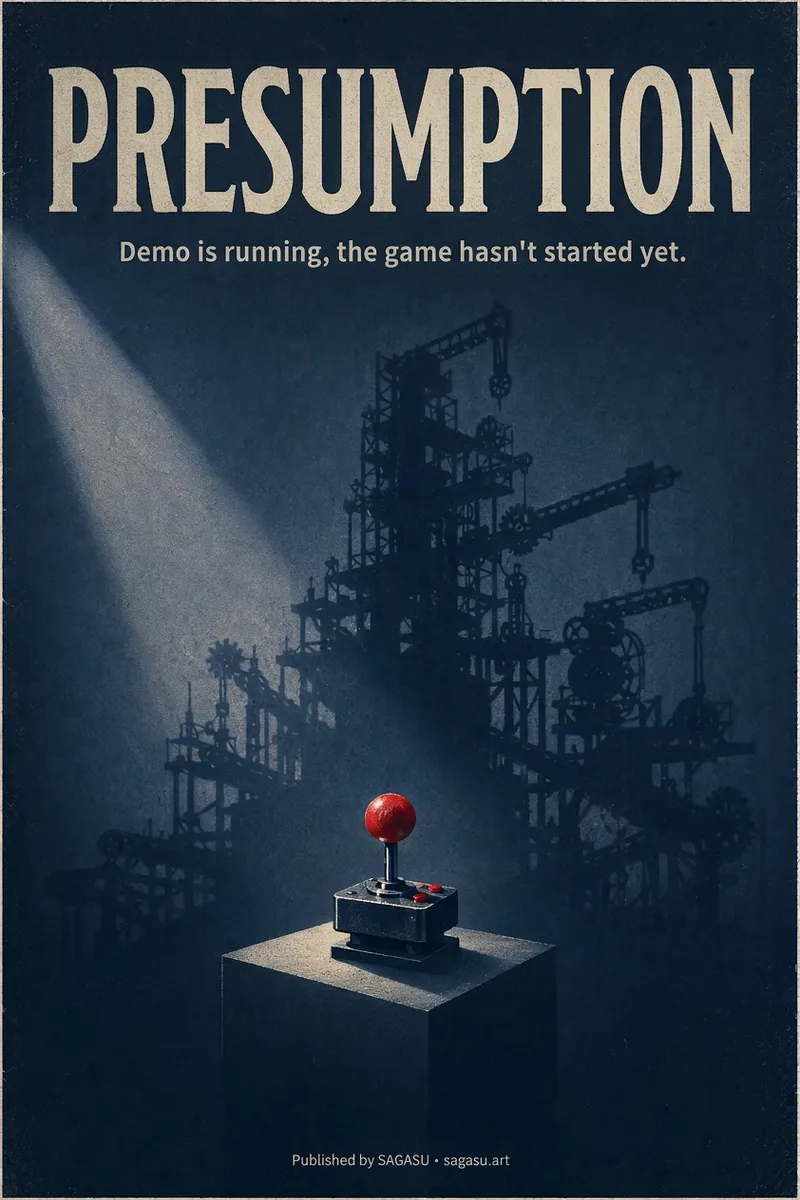 Image
ImageCinematic Cover Studio v2.0
You wrote an article with a strong point, but can only pair it with a randomly chosen image? Cinematic Cover Studio turns your article’s central idea into a cinematic poster-style cover: the image catches attention in the feed at first glance, and viewers understand what it says at second glance—so they stop and click. Just paste in an article link or describe the topic in one or two sentences. It will understand the content, identify the most compelling tension in the article, turn it into a metaphorical scene with a single main subject, then match it with the right design style, composition, and colors to deliver a finished poster. You’ll get: - A ready-to-use cover with the title and subtitle already placed in the design. Chinese articles use Chinese titles with accurate, legible text. - Platform-ready aspect ratios: 2:3 portrait by default for movie posters; 3:4 for Xiaohongshu and Instagram; 9:16 for Stories; and 16:9 for WeChat Official Accounts, Bilibili, YouTube, and blog headers, with space reserved for the title. - Five design styles to choose from or match automatically: minimalist symbolism, illustrative storytelling, surreal metaphor, Eastern atmosphere, and commercial blockbuster. - No need to answer repeated questions: when there’s enough information, it generates the image directly. By default, it creates one image at a time so you don’t waste credits. - When you want to compare options, say “give me a few more versions” to see different directions, such as literal, metaphorical, and minimalist. If it feels too dark or too cool, or you want to change the style or colors, adjust the current image with a single sentence. Ideal for creators writing for WeChat Official Accounts, blogs, newsletters, Xiaohongshu, and X, as well as anyone who needs a key visual for opinion-based content, product introductions, or events.
 Image
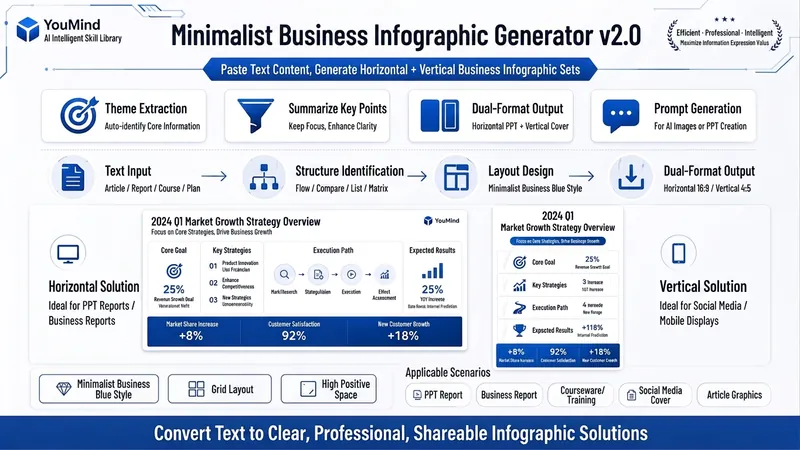
ImageBiz Infographic Generator v2.0
Transforms complex text into clear, professional, presentation-ready business minimalist infographics. It can help you: 1. Automatically extract core information Extract topics, keywords, logical relationships, and key points from user-provided text, materials, course content, meeting minutes, or reports. 2. Automatically design infographic structure Match business expression formats such as flowcharts, comparison charts, hierarchical charts, matrix charts, checklist charts, and path charts based on content type. 3. Automatically generate dual-format solutions Output two sets of infographic designs: landscape and portrait. Landscape is suitable for PPT, presentations, and web display; portrait is suitable for Xiaohongshu, WeChat Moments, public account covers, and vertical screen display. 4. Automatically generate diagram prompts Output complete diagram prompts ready for use with AI drawing tools, designers, or PPT tools. Suitable for: Professionals, knowledge bloggers, trainers, course creators, consultants, operations staff, PPT designers, business report creators. How to use: Directly paste a piece of text, materials, course content, meeting minutes, or report summary. You don't need to organize the structure first; I will automatically extract the core content and generate both landscape and portrait business minimalist infographic solutions.
 Image
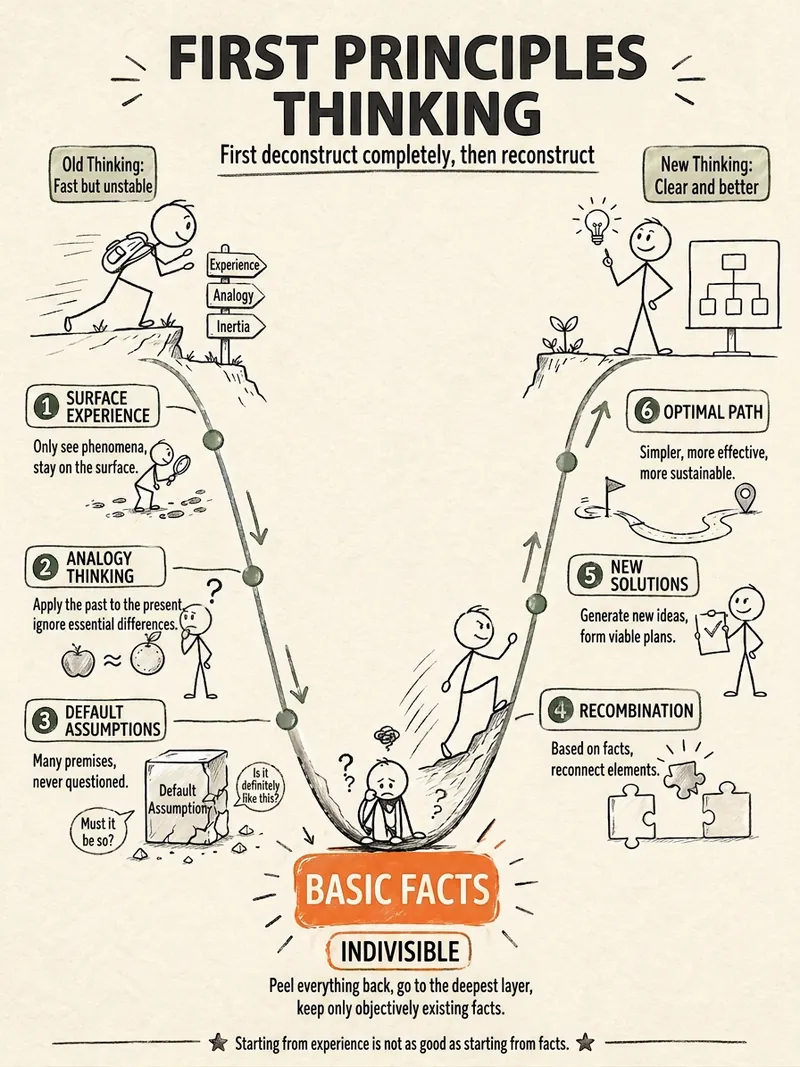
ImageStick Figure Explainer
Turn complex concepts, abstract theories, lengthy processes, notes, business analyses, or growth stories into prompts for vertical knowledge cards, infographics, and hand-drawn explainers optimized for GPT-Image 2. Whether you’re organizing a process, comparing before and after, analyzing causes, categorizing knowledge, or telling a story of growth from a low point to a breakthrough, it distills the key takeaway and matches it with a suitable composition, visual metaphor, and reading flow—making the content easier to understand and remember at a glance. You’ll receive a Chinese card structure guide and visual system recommendations covering composition, hand-drawn style, color philosophy, and typographic character, along with a ready-to-copy English image-generation Prompt. The default canvas is a 3:4 vertical format, suitable for knowledge cards, Xiaohongshu cards, vertical infographics, and posters. Depending on the topic, stick figures, simplified characters, or icons can be used to show states, actions, and emotions, while keeping the number of information modules under control to avoid crowded visuals, text that is too small, or scattered emphasis. It’s ideal for quickly turning reading notes, frameworks, workplace skills, psychology and personal growth topics, business insights, product workflows, and complex concepts into clear, narrative-driven, actionable visual content.
Information
- Version
- v6
- Last updated
- Runtime credits
- Usage-based
- Models
- Auto