Everything Infographic Maker
Vertical 9-panel explainers for social posts
Everything Infographic Maker
Vertical 9-panel explainers for social posts
Showcase
Description
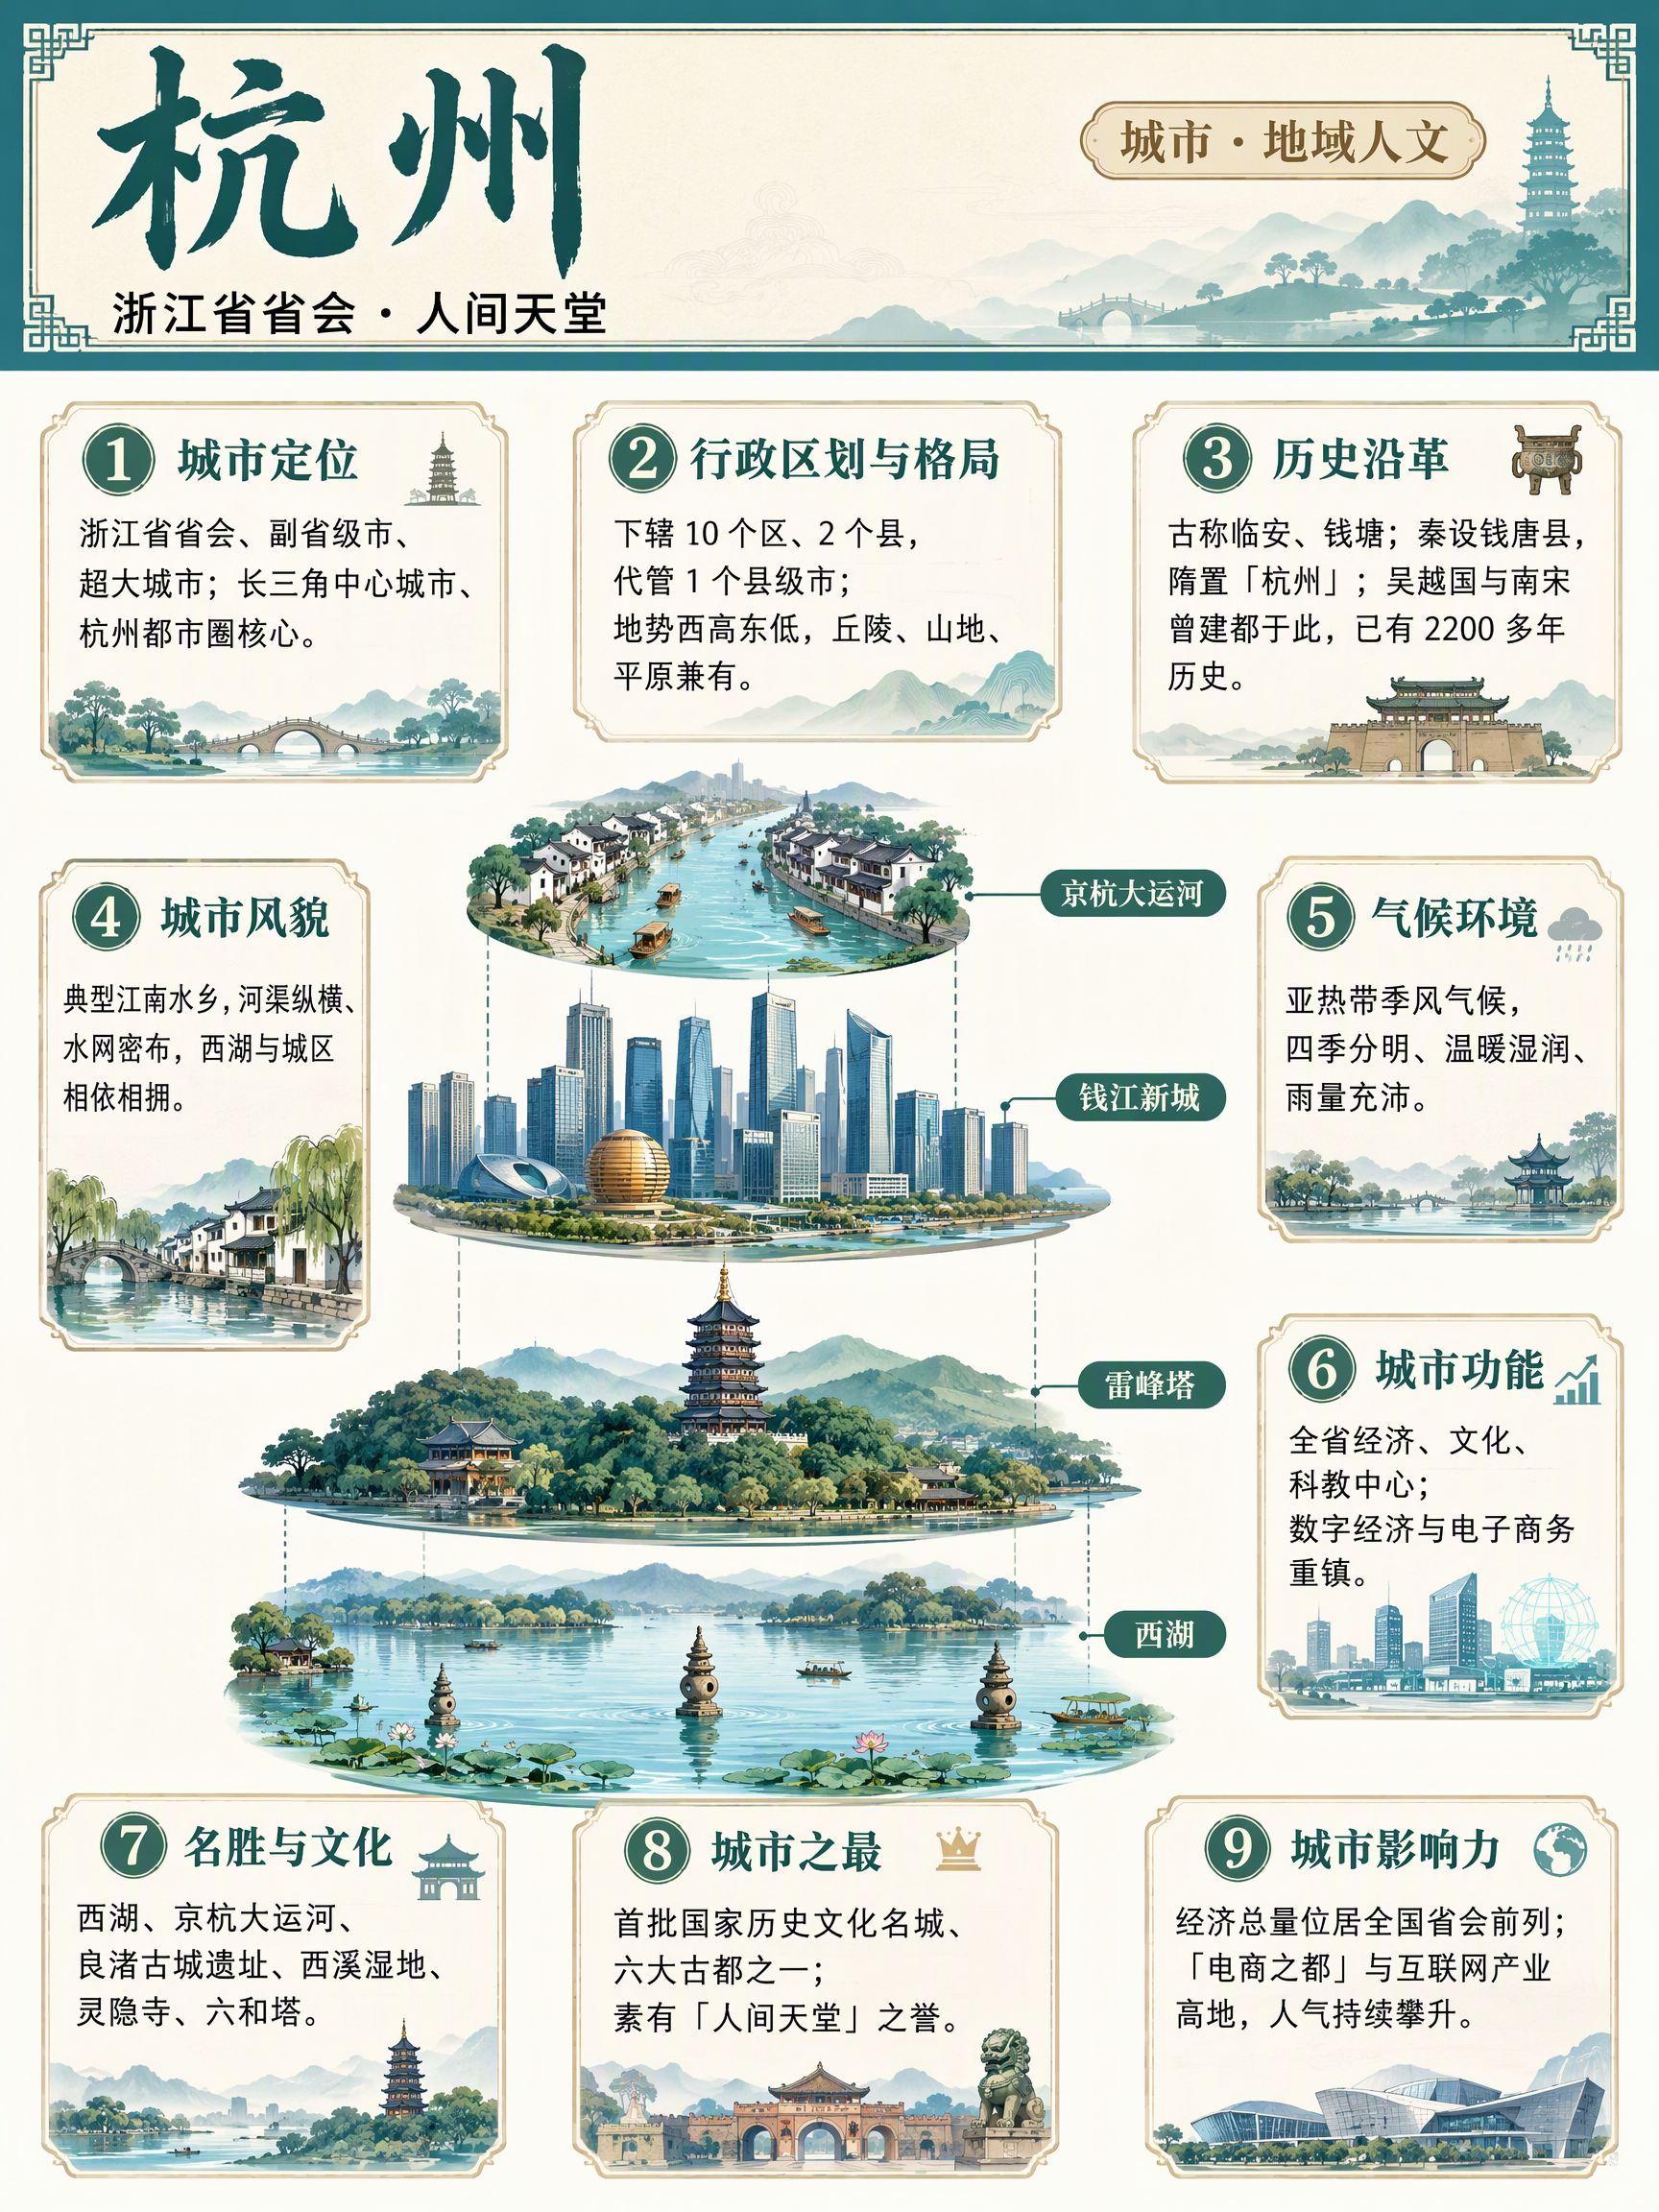
Enter an object name to generate a vertical Chinese nine-panel object breakdown infographic for topics including organisms, machinery, plants, celestial bodies, vehicles, buildings, food, and more. Even with only an object name, the skill identifies suitable category labels, visual expression, and information priorities based on the object's features, using a vertical layout and Chinese by default. The design includes a title label at the top, a centered exploded, layered, or cutaway-style subject, and nine information modules arranged around it. These help readers quickly understand the object through its classification, structure, principles, environment, functions, related things, unique features, and relationship to humans. Different categories are matched with corresponding stable themes to maintain a consistent, readable educational layout. Before generation, key facts such as scientific names, numbers, and parameters are checked. The content is condensed into clear Chinese copy, then paired with an illustration or engineering diagram style suited to the object type to create an infographic with legible text and an orderly layout. You can also specify the audience, purpose, visual style, language, or aspect ratio to better fit presentation, teaching, and educational communication scenarios.
Recommended by
Dancang
Why we love this skill
Turns any organism, machine, or object into a consistent vertical 9-panel explainer with automatic categorization and nine themed sections—ideal for ongoing content and batch commissions.
Best for
Content creators, educators, and learners who need object breakdown diagrams, teaching visuals, or educational content.
How to use this Skill
Provide your input
Enter an object name. You can also specify the audience, purpose, visual style, language, or aspect ratio.
Run the Skill
The system identifies the object category, organizes key information, and arranges it into a fixed infographic structure.
Review your result
Get a vertical educational infographic with a top title, a central exploded object view, and nine surrounding information modules.
Related Skills
View all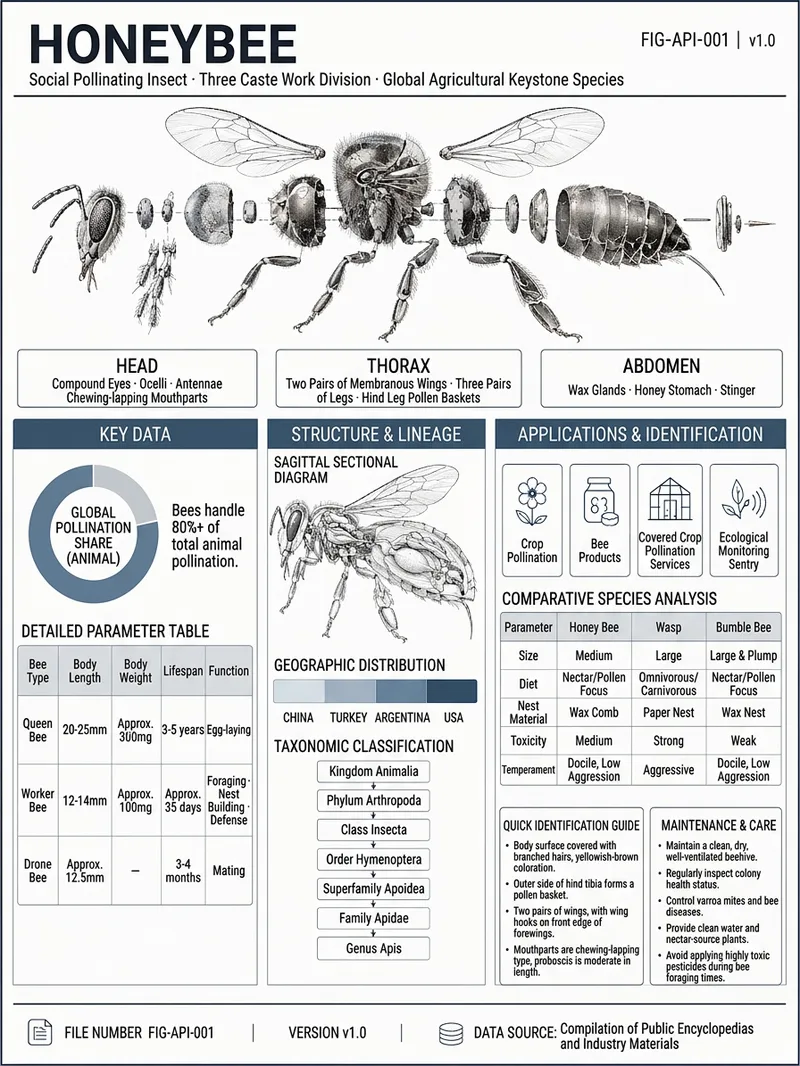 Image
ImageViral Infographic Maker
Enter an object name and any optional requirements to receive a research-verified reference infographic about it. Whether it is machinery, an electronic product, a living organism, a building, a vehicle, or a natural object, the system organizes its English name, field, key parameters, structural components, geographic or industry distribution, development lineage, use cases, comparisons with similar objects, identification points, and maintenance recommendations, while recording traceable data sources. Information that cannot be confirmed is clearly marked “Unverified.” The finished design uses a low-saturation gray-blue industrial drafting style, with an exploded view of the main subject and structural cross-section diagrams. Key data is presented as parameter tables, ring charts, distribution maps, lineage diagrams, and comparison panels to help readers quickly understand the object’s appearance, construction, performance, and applications. For abstract or data-based subjects, suitable geometric diagrams or data visualizations are used instead. The final deliverable is a strictly 3:4 infographic poster suitable for high-resolution viewing and print, along with an editable HTML source file. The layout includes title identification, main subject illustrations, structured information modules, and source notes, with a focus on complete content, clear text, and verifiable data.
 Image
ImageViral Info Atlas Maker
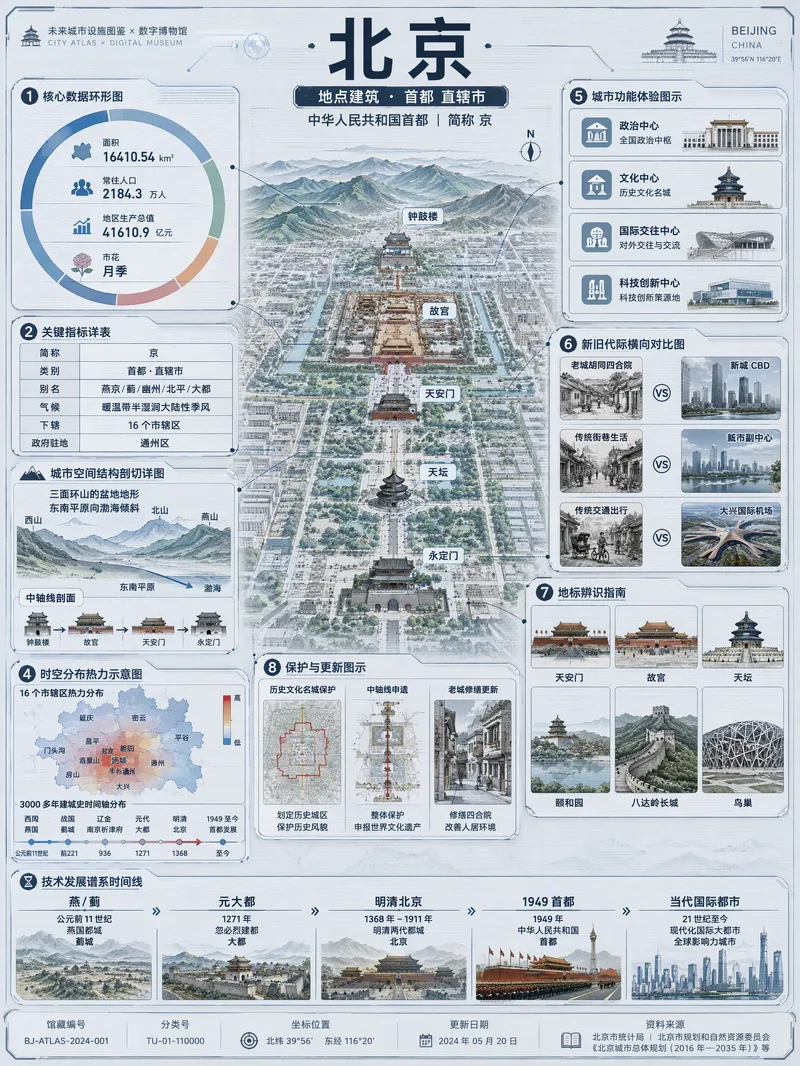
Quickly turn any subject name into a technology-inspired natural history atlas poster that combines rich information with strong visual appeal. Whether it’s a living thing, mineral or material, man-made object, place or building, cultural concept, or historical figure, the Skill organizes content for display and sharing based on your audience, focus, and language requirements. The Skill first uses real-time web research to verify definitions, key data, structure and composition, distribution, applications, evolution, identifying features, and more. It then arranges the content into a 3:4 vertical infographic. The poster centers on a specimen-style subject, surrounded by nine adaptive information modules covering core metrics, structural analysis, spatial and temporal distribution, context and use cases, comparisons, identification points, conservation or maintenance tips, and a development timeline. Module themes and information priorities are adjusted to fit the type of subject. The finished piece uses light gray-blue technical cardstock, precise linework, low-saturation cyan and blue washes, and a semi-transparent scanned texture. The result combines the visual style of a future-city infrastructure atlas with a digital museum display panel, while retaining the subject label at the top and a collection records area at the bottom. For obscure subjects or when information is limited, speculative content is distinguished with visual prompts. It is suitable for science education, exhibition introductions, knowledge sharing, and social media publishing.
 Image
Image(Trending) Anything as an Infographic
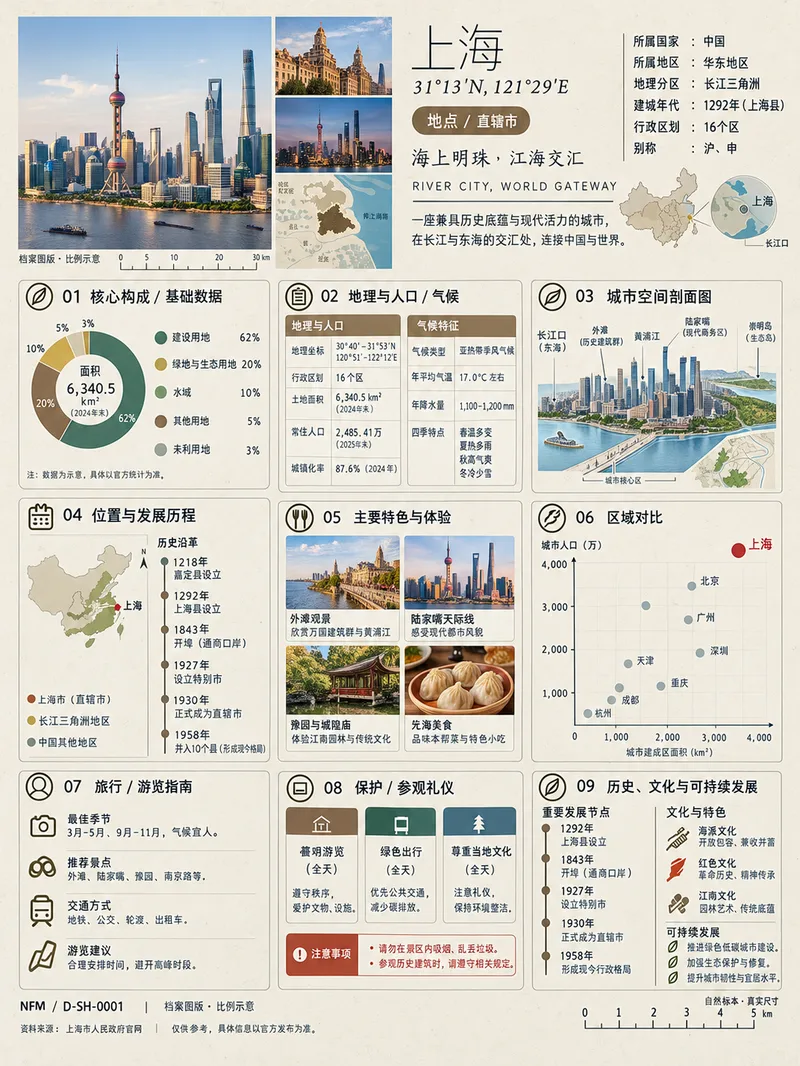
A trending infographic generator. Enter the name of any subject, and it automatically identifies the type—such as a living thing, mineral or material, man-made object, place or building, cultural concept, or historical figure—then creates a dense 3:4 portrait infographic poster using a fixed “natural specimen archive × modern museum guide plaque” layout system. It includes a header identification area, specimen-style image area, a central 3×3 grid with a core data radial chart, detailed key metrics, structural cross-section, spatial and temporal distribution, applications and user experience, side-by-side comparison, identification guide, preservation and maintenance, and historical lineage, plus a collection number and reference information area at the bottom. The layout, grid, typography, and color systems are consistent, making the posters easy to collect as a series. GPT Image 2 is used by default as the best-fit image generation model. Best for: building an account from scratch and taking commissioned work.
Information
- Version
- v2
- Last updated
- Runtime credits
- Usage-based
- Models
- Auto
- Use cases
- Images & designLearning & education
- What you get
- Image