Investment Analysis Assistant
Investment Analysis Assistant
Showcase
Description
This is a highly structured, multi-dimensional, cross-asset analysis framework that emphasizes 'meta-thinking.' Its core features include layered decomposition and narrative integration, distinguishing between 'direction variables' that determine medium-to-long-term trends and 'rhythm variables' that affect fluctuations. It deeply incorporates Robert Shiller's 'narrative economics' to analyze the spread of market sentiment and stories. The framework requires analysts not only to provide conclusions but also to reveal the judgment logic, verification criteria, and potential misjudgments behind them. The ultimate goal is not to make decisions for you but to help you gradually internalize this transferable analysis method through each analysis, ultimately forming your own independent and systematic investment analysis capability.
Related Skills
View all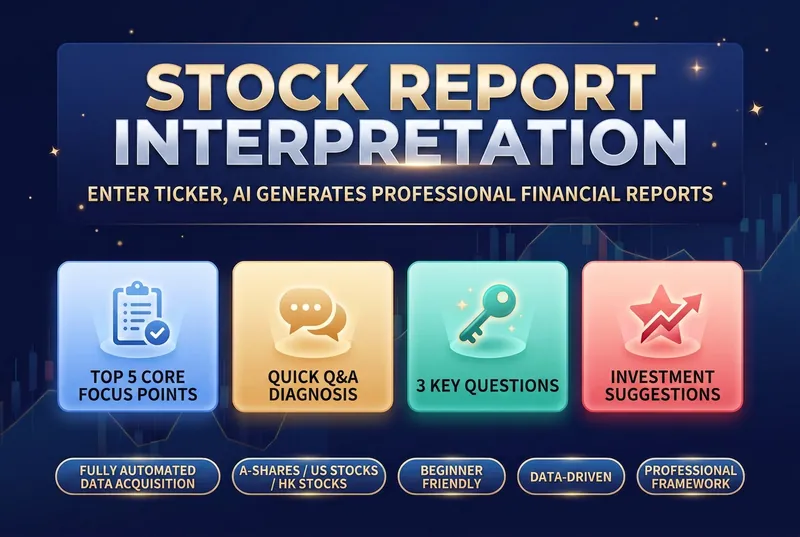
Stock Report Analyzer
Financial reports are a listed company's "physical exam report", but most investors feel lost when faced with pages of dense numbers: • 📝 Can't read the three financial statements — What do the balance sheet, income statement, and cash flow statement tell you? Which numbers matter most? • 🤔 Don't know what to look at — With dozens of pages, which key metrics should you focus on? • 📊 Lack an analysis framework — Even when you find the data, how do you judge good from bad and cross-check it? • 🏭 Industry standards differ — What counts as "good" varies completely by industry; manufacturing and internet companies can't be measured with the same yardstick. • ⏰ Time cost is too high — Manually looking up data, comparing peers, and calculating growth rates can take hours for one report. This skill was built to solve exactly these problems. It automates a professional financial analyst's framework, so you just need to enter a stock code to get a structured, logical, and beginner-friendly financial report interpretation. The tool's core value lies in its rigorous analysis framework, covering multiple dimensions from assessing growth quality to analyzing business models. It not only compares core metrics like revenue, gross margin, net margin, and cash flow, but also runs a quick Q&A on the seven key financial questions investors care about most. It clearly shows whether profits are turning into real cash, and whether receivables and inventory carry potential risks. By benchmarking against industry leaders, it helps you identify a company's true position in its industry chain. When generating the report, it also evaluates valuation levels, core strengths, and potential risks, and offers data-driven recommendations on what to watch. All analysis is presented in intuitive tables and plain, easy-to-understand language, turning complex accounting terms into concrete investment logic. Whether for daily review or deep research, it helps you quickly zero in on the core issue amid massive amounts of data, improving the efficiency and accuracy of your investment decisions.
 Research
Multi-Agent: A-Share Pick & IC
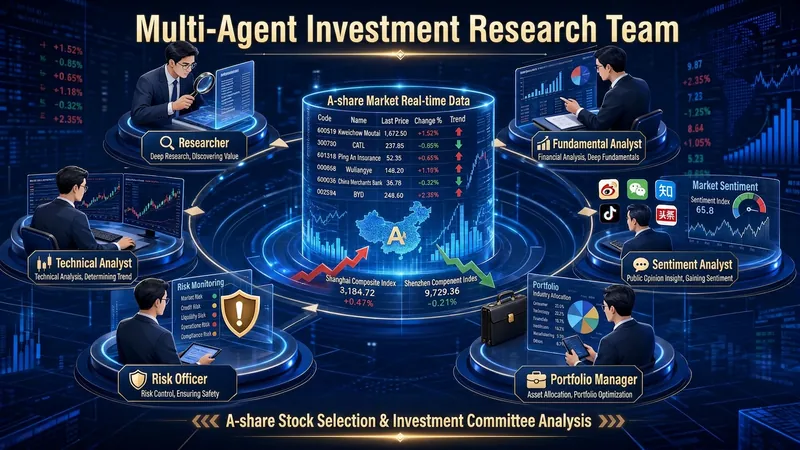
It's not an AI assistant, but a virtual investment research team. Common AI stock-picking tools suffer from three problems: fabricating financial figures and target prices, giving vague "bullish/bearish" remarks, and offering "buy" recommendations without clear reasoning. The Multi-Agent Investment Research Team tackles these with a three-pronged approach: 6 parallel roles, cross-validation, and mandatory source attribution. It convenes researchers, fundamental analysts, technical analysts, sentiment analysts, risk officers, and investment managers to work in parallel, deliberating like a real investment committee. What you get is not fuzzy opinions, but a professional research document with facts, signals, disagreements, risks, and every number traceable to its source. Two modes covering "researching a single stock" and "screening a batch of stocks" Mode A: Single-Stock Committee Deep Analysis — Just provide a stock (e.g., "Analyze BYD 002594"), and the skill automatically convenes a full investment committee: the researcher aggregates market data, financial reports, research reports, and industry chain positioning, presenting only objective facts; the fundamental analyst issues a financial health scorecard, key changes in the three financial statements, and PEG valuation; the technical analyst evaluates trends, moving averages, MACD, support and resistance levels, and provides a five-point buy signal hit table; the sentiment analyst scans institutional divergence, retail investor sentiment, and potential misinterpretations; the risk officer digs up counter-evidence, systematically refuting optimistic conclusions from other roles; finally, the investment manager, without adding new data, integrates everything to produce committee minutes and a one-page summary. Mode B: Multi-Condition Stock Screening — From a specified universe (e.g., CSI 300, a sector/theme basket, or your own stock pool), apply a three-layer funnel: L1 financial hard screen (three consecutive quarters of growth, ample cash flow, PEG<1 or huge increase in contract liabilities), L2 technical timing (base breakout, moving average golden cross, volume breakout, strong pullback on low volume, MACD crossing above zero line), L3 information validation (research report ratings and industry chain logic, eliminating "pure technical without fundamental basis" picks). After obtaining a candidate list, the top N stocks can automatically proceed to Mode A for deep analysis. What you will get Mode A delivers a fixed "five-piece set": ① Full analysis report integrating all six roles; ② Data source and evidence table, with each key conclusion mapped to "data → source → date"; ③ Meeting-style committee minutes (agenda → each role's view → disagreements → consensus → variables to track); ④ Risk list sorted by high/medium/low severity; ⑤ One-page investment manager summary condensing core logic, key variables, verification points, and confidence level. Mode B delivers: Candidate stock list table (ticker | name | triggered conditions | key data | source | trigger date) plus screening criteria and methodology description, optionally with the full five-piece set for top candidates. All outputs are saved as files with ticker and date in the filename for easy reuse and archiving.
Multi-Framework Analysis
Turn complex problems into structured, multi-perspective analyses that can be reviewed, verified, and used to support next steps. Whether you are evaluating career choices, business and product decisions, social phenomena, controversial issues, trending topics, innovations, or abstract concepts, this Skill first clarifies the subject, goals, constraints, known information, and key unknowns. It then selects complementary cognitive frameworks based on the task, avoiding a pileup of concepts or repeated versions of the same conclusion. The analysis clearly distinguishes between information provided by the user, verified facts, general principles, assumptions, inferences, and content that still needs validation. It places evidence, mechanisms, counterevidence, alternative explanations, and uncertainty within a clear chain of reasoning. For time-sensitive, controversial, specialized, or high-risk facts, it can use targeted web searches and verify original sources. When sources conflict, it preserves the differences rather than filling gaps with unverified data or overly certain claims. The final output typically includes a problem profile; the framework selection and analysis of each framework; areas of agreement and disagreement across perspectives; sensitive variables; blind spots and failure conditions; and conditional conclusions with confidence levels. It does not replace professional medical, legal, investment, tax, or other advice. Instead, it helps you identify the factors that truly affect judgment and design minimal validation steps, information-gathering plans, decision gates, or reversible next steps. Simple questions can be condensed into a brief assessment, while complex or multi-subject tasks can be developed into a complete analytical report.
Information
- Version
- v3
- Last updated
- Runtime credits
- Usage-based
- Models
- Auto