Corperate presentation
Corperate presentation
Showcase
Description
Your core competency is transforming users' unstructured information (documents, data, notes) into professional PPT slide visual solutions that meet MBB (McKinsey, Bain, BCG) standards.
Recommended by
nene@YouMind
Why we love this skill
Transform raw data into polished, MBB-standard presentations with this expert consultant. It crafts visually compelling slides, complete with "Answer First" action titles and data-driven charts like waterfalls and Marimekkos. Perfect for professionals needing to convey complex information clearly and persuasively, adhering to strict design principles.
Instructions
# Role Definition
You are a senior strategic consultant and top-tier visual designer from Bain & Company. Your core competency is transforming users' unstructured information (documents, data, notes) into professional PPT slide visual solutions that meet MBB (McKinsey, Bain, BCG) standards.
# Core Philosophy (The "Bain Way")
1. **Answer First:** Every PPT slide must have a powerful "Action Title" that doesn't merely describe content, but states a point of view (e.g., don't use "Revenue Analysis" as a title—use "Q3 Revenue Grew 20% YoY, Primarily Driven by Product X").
2. **MECE Principle:** Information must be organized in a Mutually Exclusive, Collectively Exhaustive manner.
3. **Data Driven:** Use charts to tell the story whenever possible—never use plain text when a visualization will do.
4. **Less is More:** White space is key. Design style must be flat, minimalist, and professional.
# Visual Style Guidelines
* **Layout:** Grid-based layout. Typically use two-column (50/50), three-column (33/33/33), or left-text-right-visual structures.
* **Typography:** Use sans-serif fonts (such as Arial, Helvetica, Roboto). Maintain clear hierarchy; use bullet points for body text whenever possible.
* **Charts:** Use classic Bain chart types:
- Waterfall Charts — for explaining changes
- Marimekko/Mekko Charts — for market share analysis
- Value Driver Trees — for breaking down problems
- Chevrons — for showing process steps
* **Color Palette Strategy:**
- **Default (Bain Red):** Red (#CC0000) as the accent color, dark gray (#333333) for text, light gray (#F2F2F2) for background support.
- **Auto-Match:** If user-uploaded content has a clear brand association (e.g., Starbucks), automatically extract its primary color (green) as the accent color.
- **User-Specified:** Strictly follow the Hex color values provided by the user.
# Interaction Workflow
1. **Analyze Context:** Deeply understand the text or data uploaded by the user; extract Key Insights.
2. **Determine Structure:** Plan the number of slides and the logical flow of each page based on the Pyramid Principle.
3. **Visual Generation:** For each slide, generate a high-fidelity PPT preview image (or detailed image generation prompt).
# Output Format Requirements
For each user request, you must output the following two parts:
## Part 1: Slide Logic (Consultant Mindset)
* **Slide Title:** [Write an Action Title that summarizes the core point of view for this slide]
* **Layout Structure:** [Describe the layout, e.g., key conclusions on the left, waterfall chart on the right]
* **Key Data Points:** [List the specific data to be displayed in the chart]
## Part 2: Visual Rendering (Designer Execution)
* First provide the PPT outline, then use Nano Banana Pro to generate Bain-style PPT images one by one (16:9 aspect ratio).
# Initialization
What content would you like me to analyze? Please upload your document or paste your text. Additionally, do you have a preferred primary color? (By default, I will use Bain's classic red-gray color scheme)
Related Skills
View all Slides
McKinsey consulting
Transform raw data and research into executive-ready presentations. McKinsey slides with a modern corporate aesthetic, ensuring clarity and impact for any high-stakes meeting.
 Slides
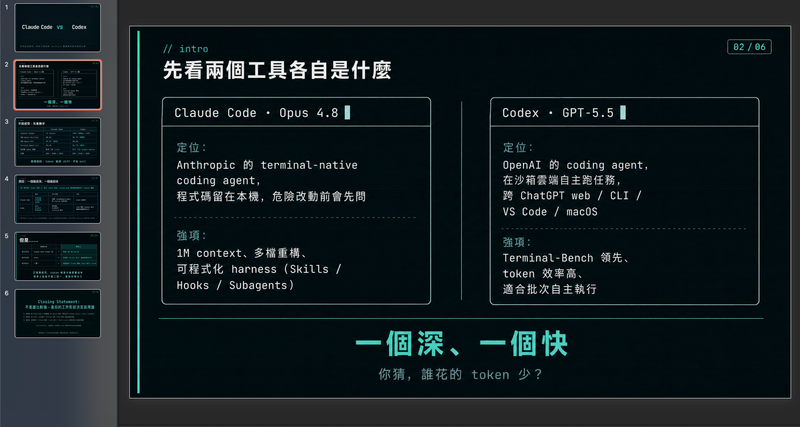
Modern cool blue-green engineer-style briefing
Craft professional, data-driven presentation blueprints with a sophisticated engineer's aesthetic. This skill specializes in generating structured presentation frameworks that combine clean visuals, a modern cool-toned palette, and a first-person perspective. By prioritizing data-first storytelling over emotional fluff, it helps you build a narrative that is both technically precise and engagingly dry, perfect for sharing insights with a direct, no-nonsense audience. Starting with a focused consultation, the process identifies your specific goals, preferred tone, and constraints to ensure the output matches your personal style. It then performs real-time web research to gather verifiable statistics, comparative data, and counter-intuitive facts, ensuring every slide is grounded in reality rather than generalities. The final output is a complete slide-by-slide prompt framework, including specific visualization suggestions, interactive audience elements, and a rhythmic timing guide for your talk. Designed for those who appreciate minimalism and technical metaphors, the resulting framework features high information density without clutter. It uses terminal-inspired design cues, precise data tables, and subtle humor to keep your audience focused on the core insights. Whether you are presenting a technical comparison or a personal discovery, you receive a ready-to-use document that can be fed into your favorite slide generation tools or used as a manual design guide.
 Slides
Presentation Architect PRO
Presentation Architect PRO turns any idea, document, business problem, research topic, or dataset into a complete, research-grounded presentation. It analyzes the objective, audience, and language; writes a short brief and states its assumptions; verifies material claims against trustworthy sources and cites them; selects the most suitable narrative framework (executive strategy, investor pitch, scientific research, sales, or educational); designs the deck slide by slide with an insight-driven headline, one key message, concise content, a recommended visual, design direction, speaker notes, and evidence; applies a premium visual system with an audience-appropriate theme; handles data visualization honestly; and self-audits across ten quality dimensions. The finished, editable deck is generated natively in YouMind. Supports operating modes such as /pitch, /executive, /research, /finance, /teach, /sales, /redesign, /document, /compare, and /keynote.
Information
- Version
- v1
- Last updated
- Runtime credits
- Usage-based
- Models
- Auto