
AI Problem Decomposer
Break down questions into clear diagrams
AI Problem Decomposer
Break down questions into clear diagrams
Showcase
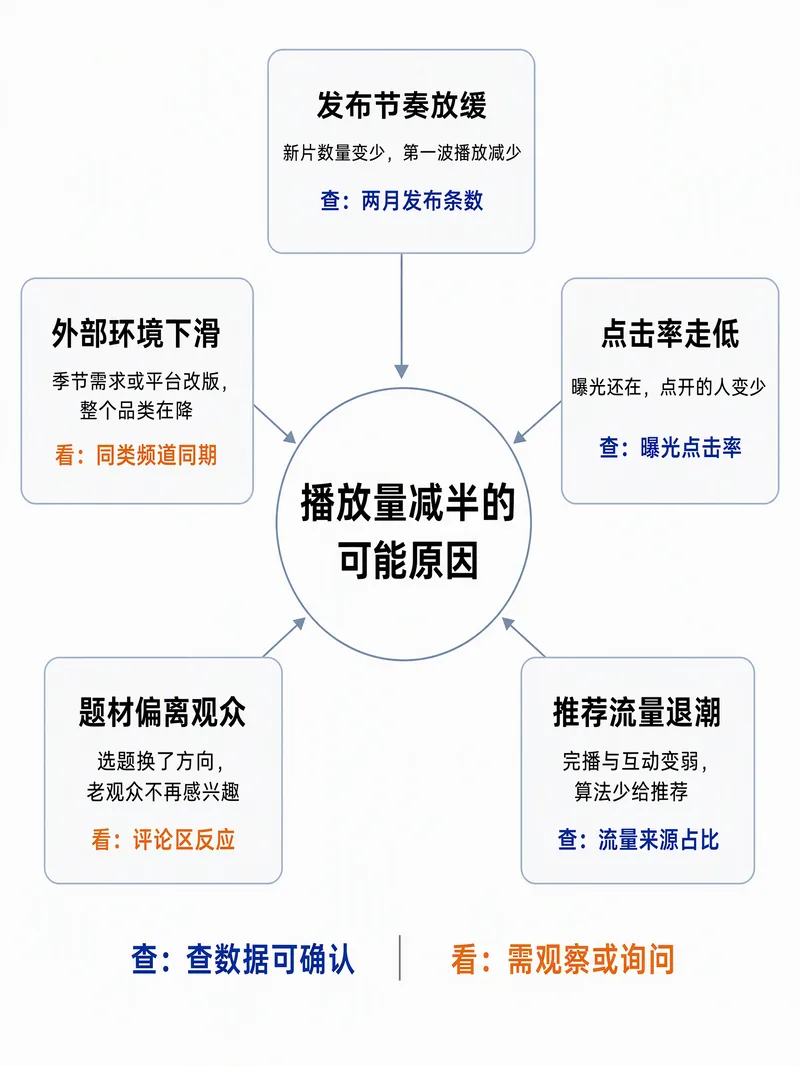
修改AI问题拆解师Skill指令
播放量减半的可能原因(修正版)
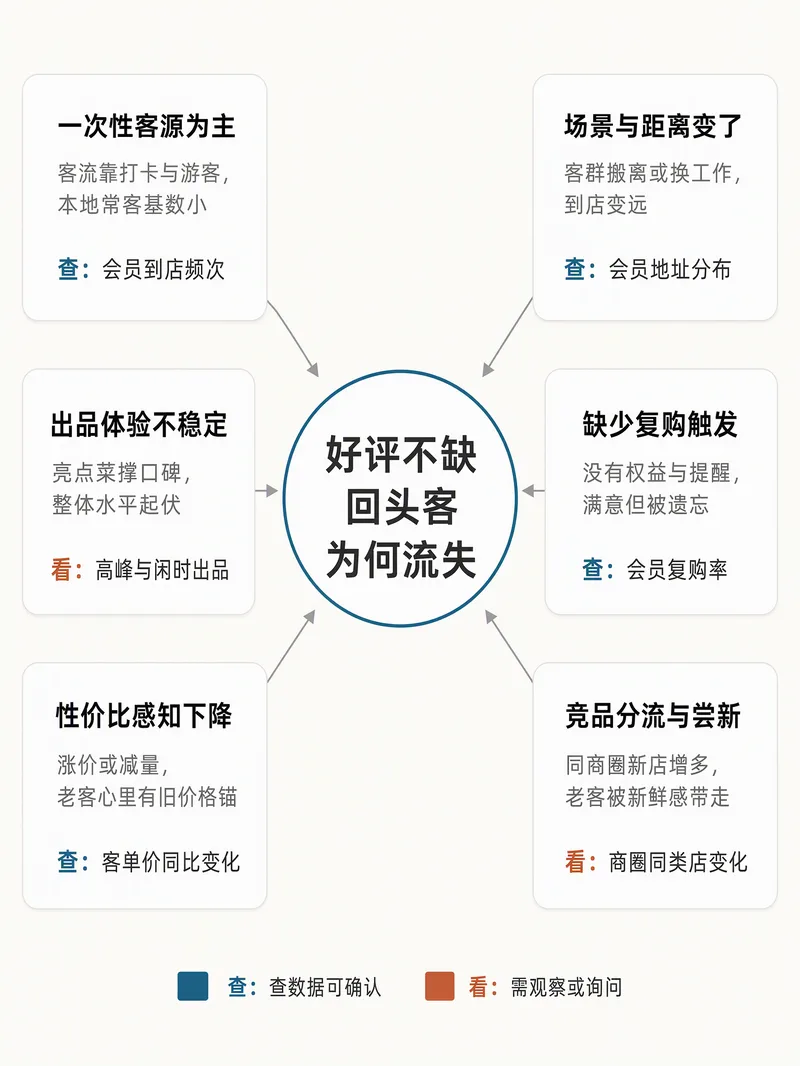
餐厅回头客减少原因分析
好评不缺,回头客为何流失
修改AI问题拆解师Skill指令
播放量减半的可能原因(修正版)
餐厅回头客减少原因分析
好评不缺,回头客为何流失
Description
# AI Problem Decomposer **One complex question, one clear analysis diagram.** Why is store traffic unchanged while profits keep falling? Why did video views suddenly drop? Why are projects always delayed? Enter the question you want to understand, and AI will break down possible causes, map out cause-and-effect relationships, determine what to investigate first, and generate a clear, easy-to-understand Chinese-language analysis diagram. It does more than tell you **what the possible causes might be**. More importantly, it tells you: **why they might be happening and what to check next.** ## What you'll get **① Intelligent problem breakdown** Identify the key parts of a problem. For situations that can be analyzed with formulas, the tool prioritizes establishing metric relationships to help identify what needs to be investigated. **② 4–6 possible causes** Each cause includes: - Possible symptoms - The cause-and-effect mechanism behind the outcome - A practical way to verify it Unverified speculation is not presented as fact. **③ Intelligent investigation order** Based on impact, verification difficulty, and the information available, the tool recommends what to check first and what to check later, helping you avoid investigating blindly. **④ One professional Chinese-language analysis diagram** The tool automatically selects a suitable structure based on the question, such as a radial map, causal chain, fishbone diagram, or timeline. Different colors distinguish information types, and specific action prompts are placed next to causes, such as: - Check: impression click-through rate - Check: product gross margin - Review: customer comments and feedback **⑤ Image text check** After generation, the tool checks the Chinese text, number of causes, and consistency between the diagram and its content. If obvious text errors are found, it attempts one automatic correction based on the run settings; additional generation may use more credits. ## What kinds of questions is it suited for? **Business operations** - Why are profits falling even though store traffic is unchanged? - Why are returning customers decreasing despite good reviews? **Content creation** - Why did YouTube views suddenly drop? - Why are impressions high but click-through rates low? **Work and learning** - Why are projects always delayed? - Why hasn't performance improved significantly despite investing more time in learning? ## How to use it 1. Enter a specific question you want to analyze. 2. Include any data, screenshots, or reference materials you have. 3. AI breaks down the causes, analyzes the mechanisms, and provides verification methods. 4. Generate a Chinese-language multifactor analysis diagram to help you investigate each item step by step. ## Usage tips - The more specific the question and the more complete the data, the more targeted the analysis will be. - Do not fabricate statistics, survey results, or external sources. - The causes shown in the diagram are analytical hypotheses and do not mean the actual causes have been confirmed. - Generated images may contain layout or text errors. - A single test run uses approximately 100–200 credits. Actual credit usage depends on the model, task complexity, and whether additional generation is needed. **Make complex questions easier to understand, investigate, and act on.**
Recommended by
Dancang
Why we love this skill
Moves beyond possible causes to show how to verify them, connecting symptoms, mechanisms, and actionable checks in a focused information diagram. Separates hypotheses from facts for more rigorous investigation and faster decisions.
Best for
For business owners, creators, project members, and learners who need to break down complex problems, map cause and effect, and decide where to investigate.
How to use this Skill
Provide your input
Enter a specific complex question. You can also attach relevant data, screenshots, or reference materials.
Run the Skill
The tool breaks down possible causes, maps out impact mechanisms, recommends an investigation order, and chooses a suitable diagram structure.
Review your result
Get a Chinese-language analysis diagram with causes, verification methods, and action prompts to help you investigate each item by priority.
Related Skills
View all Image
AI One-Photo Ad Maker
Upload one product photo and let AI create e-commerce advertising materials for you! No professional design experience is needed. AI first identifies the product’s appearance, colors, quantity, and key details, then plans four advertising visuals for different marketing purposes based on the product’s characteristics. **Core features:** - Analyzes your product and recommends marketing styles and advertising concepts. - Plans four images for different purposes by default, with options to adjust them as needed. - Review the plan first and authorize generation afterward to reduce unnecessary credit usage. - Tries to preserve the product’s original colors, structure, material, and quantity. - Reviews product fidelity and image quality after generation, and provides marketing copy suggestions. **Best for:** E-commerce sellers, department store owners, social media operators, and businesses without design experience. **How to use:** Upload a product photo → Review the advertising plan → Authorize generation → Check the review results → Get your marketing materials. **Please note:** AI-generated images may contain inaccuracies in product details, so check them manually before official use. Image generation may consume platform credits. Sales or advertising performance is not guaranteed.
 Image
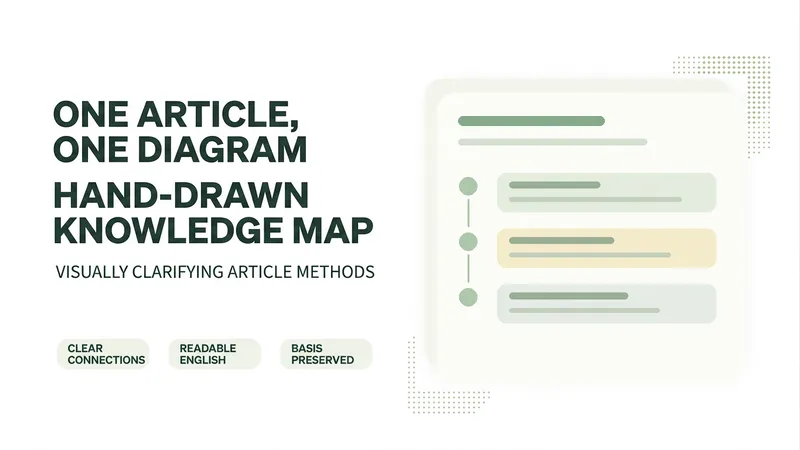
One Text, One Visual
Have you saved lots of articles but still struggle to find the key points at a glance? Give it an article, note, or clearly defined topic that you have permission to use. It will organize the information around one question and present it as a hand-drawn-style diagram. The first version focuses on method steps and operational workflows. You’ll get: ① A knowledge diagram with clear steps, conditions, and reading order. ② Copyable text, including the title, nodes, and key explanations. ③ A source checklist that preserves the original evidence and items requiring confirmation. ④ Short sharing copy to make it easy to post with the image. It won’t depict parallel content as causal, omit key conditions, or invent performance data. When there is too much content, it will narrow the topic first while preserving readable type size and whitespace for mobile viewing. Creating the final image requires access to an image or drawing tool in the current environment. If no tool is available, it will clearly state that the image has not been generated and preserve the complete image-ready draft. Image-generation usage is subject to the platform’s rules at the time. Suitable for study organization, knowledge sharing, and adapting content for social media. It does not publish on your behalf or guarantee traffic. The sample image uses a newly created article and local drawing tools; it is not a YouMind runtime screenshot.

9D Visual Deconstruction
Break down one or more infographics, data visualizations, flowcharts, timelines, maps, knowledge graphs, and organizational charts into reusable visual and information structures. Understand precisely why an image is organized the way it is and reconstruct a similar communicative effect. The skill examines spatial composition, dimensionality and materials, color hierarchy, typography and layout, and module relationships, while also identifying chart encodings, reading paths, visual-symbol metaphors, and geographic or network relationships—so the analysis goes beyond simply describing what the style resembles. You will receive a parameterized visual deconstruction covering the canvas and compositional logic, visual hierarchy, text density, module topology, ways of expressing data and relationships, and the narrative flow within the image. For statistical charts, maps, and relationship networks, the output focuses on how data is mapped to visual variables such as color, position, size, connecting lines, and nodes. For complex subject-specific visuals, it further organizes the coordinated relationships among graphics, text, and metaphor systems. Based on this analysis, the skill generates detailed, clearly structured English image-generation prompts suitable for infographic recreation, visual research, design reference, brand content exploration, and concept development. Whether you provide an existing image or an idea for a theme and visual direction, you will receive prompts aimed at reproducing the underlying structure—not just a vague description of the style.
Information
- Version
- v4
- Last updated
- Runtime credits
- Usage-based
- Models
- Auto
- Use cases
- Images & designResearch & analysisBusiness & strategy
- What you get
- ImageDiagram