Visual Scene Deconstruction
Visual Scene Deconstruction
Showcase
Description
Visualizes complex scenes or concepts by combining a panoramic main image with zoomed-in details, integrating macro and micro perspectives, static and dynamic elements. Suitable for scene illustration drawings, as well as teaching concept illustrations for multiple subjects such as geography, physics, chemistry, biology, history, etc.
Why we love this skill
This skill deconstructs complex concepts into a panoramic view and local details. From the perspective of an instructional visualization designer, it offers personalized style choices, making learning clear and engaging.
Related Skills
View all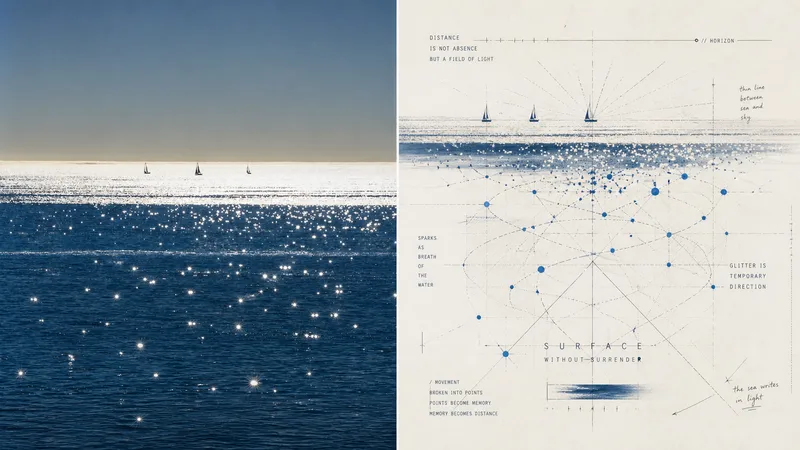 Image
ImageXiaoxiaodong × Visual Concept Maps × P090
Panel 090 treats a photo as the center of a concept, breaking down movement, direction, space, emotion, relationships, and metaphor into text, nodes, paths, regions, arrows, and connections. Textual meaning, geometric relationships, and handmade mark-making come together to form an artistic map between painting, diagram, and visual notes. Ideal for Expressing the thinking behind a photo: Organize movement, direction, relationships, and emotion into a conceptual center and visual paths. Creating artistic diagrams rather than scientific charts: Use triangular structures, zigzag lines, intersecting axes, radiating lines, contour lines, and field paths. Balancing rational structure with a sense of physical presence: Layer a clear geometric framework with repeated short strokes, ticks, symbols, dots, and subtle handwritten shifts. Needing flexible delivery: Supports vertical, horizontal, design-only, multiple aspect ratios, and four-sided wallpapers, and can also process image directories in batches.
 Image
ImageViral Info Atlas Maker
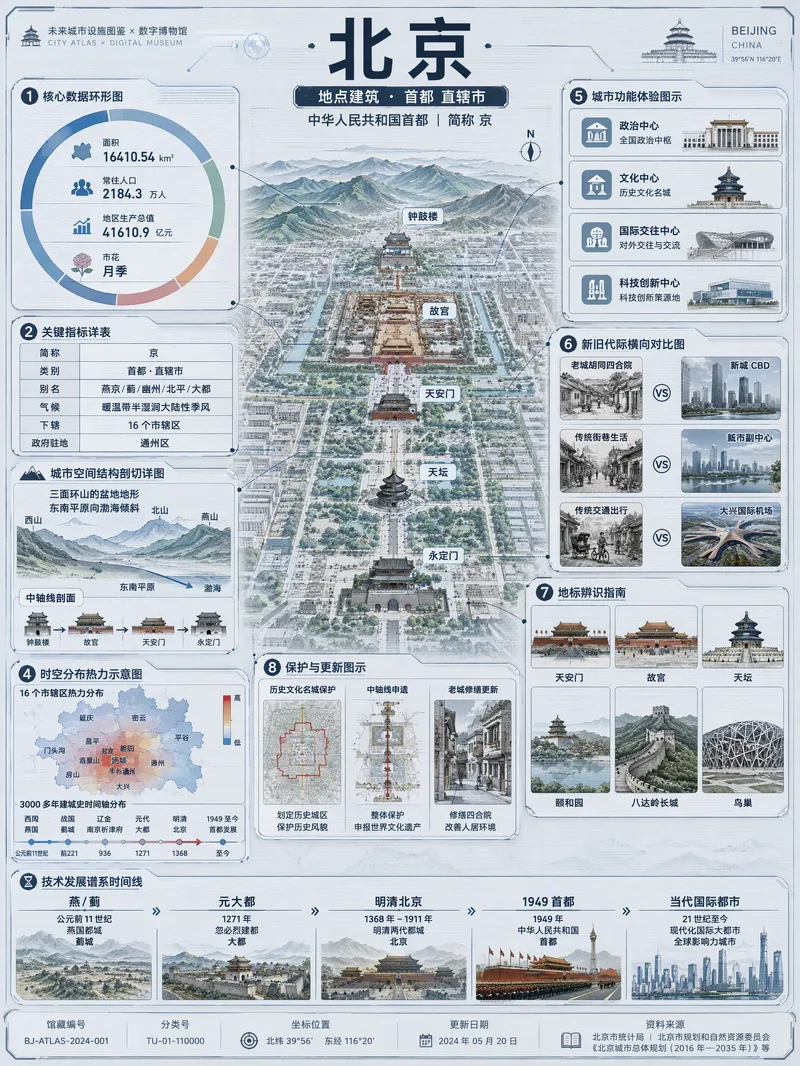
Quickly turn any subject name into a technology-inspired natural history atlas poster that combines rich information with strong visual appeal. Whether it’s a living thing, mineral or material, man-made object, place or building, cultural concept, or historical figure, the Skill organizes content for display and sharing based on your audience, focus, and language requirements. The Skill first uses real-time web research to verify definitions, key data, structure and composition, distribution, applications, evolution, identifying features, and more. It then arranges the content into a 3:4 vertical infographic. The poster centers on a specimen-style subject, surrounded by nine adaptive information modules covering core metrics, structural analysis, spatial and temporal distribution, context and use cases, comparisons, identification points, conservation or maintenance tips, and a development timeline. Module themes and information priorities are adjusted to fit the type of subject. The finished piece uses light gray-blue technical cardstock, precise linework, low-saturation cyan and blue washes, and a semi-transparent scanned texture. The result combines the visual style of a future-city infrastructure atlas with a digital museum display panel, while retaining the subject label at the top and a collection records area at the bottom. For obscure subjects or when information is limited, speculative content is distinguished with visual prompts. It is suitable for science education, exhibition introductions, knowledge sharing, and social media publishing.
 Video
VideoSpark | Video Diagram Maker
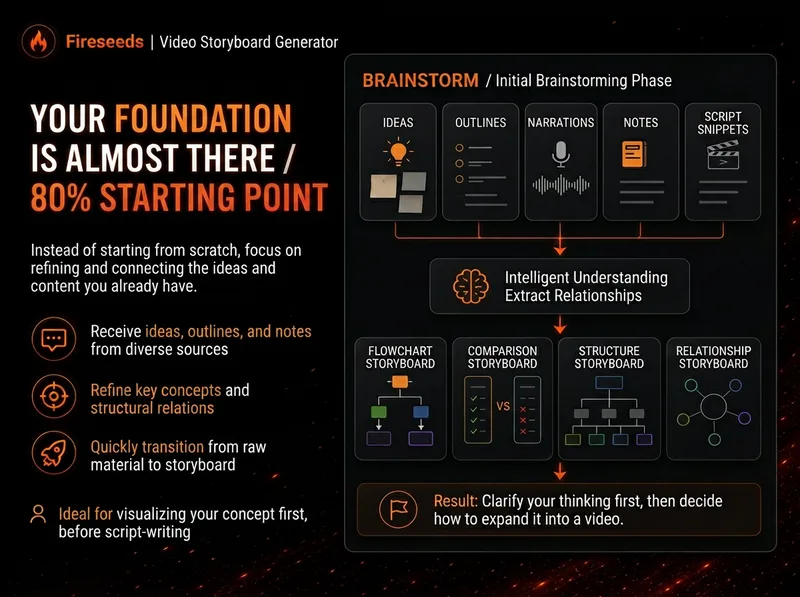
Many videos don’t lack content—the content is simply too abstract or dense. Viewers understand one sentence, then forget it by the next. “Spark | Video Diagram Maker” takes your ideas, brainstorms, outlines, scripts, transcripts, or articles and first breaks them down into concepts that are genuinely worth visualizing. It then determines whether they are best expressed as a process, comparison, architecture, hierarchy, cycle, branch, decision tree, or another diagram structure. It won’t draw just to hit a quota, or cram complex content into one cluttered infographic. Multiple diagrams maintain the same visual language, naming, and semantic color system, making them easy to insert into videos as an explanatory framework. Especially useful for: Explaining complex concepts Breaking down workflows Comparing two methods Showing system structures Clarifying cause-and-effect relationships Turning a long brainstorm into a set of visual nodes for a video The default output is a 16:9 static diagram. If the runtime environment cannot provide an editable Excalidraw source file, this will be stated clearly; static images will never be presented as .excalidraw files. Use cases Use case 1 | Turn a brainstorm into diagrams You only have a long stream of spoken ideas, without a complete script. The Skill identifies the points most worth drawing and organizes them into a set of diagrams with a clear presentation order. Use case 2 | Turn a script into visual nodes for a video You already have a complete script but don’t know where to add visuals. The Skill determines which sections are worth visualizing and selects suitable diagram types. Use case 3 | Explain complex concepts For example: how an AI Agent works, why a workflow matters more than a one-off demonstration, how a business model operates, or which layers make up a product architecture. Use case 4 | Break down a workflow or process For example: topic pool → research → Hook → script → production → review. Use case 5 | Make comparisons For example: no workflow vs. a workflow; traditional methods vs. AI methods; one-time success vs. stable, repeatable results.
Information
- Version
- v3
- Last updated
- Runtime credits
- Usage-based
- Models
- Auto