
Data Analysis & Visualization V2
Data Analysis & Visualization V2
Showcase
Description
From raw tables to reports with charts, this four-step pipeline runs everything in one go: data cleaning → in-depth analysis → visualization → a Chinese report that leads with conclusions. It automatically adapts to the reader’s role and can export to Word/PPT.
Related Skills
View all
Data Analysis Pipeline
📊 From raw Excel to reports with charts, all in one pipeline—no more jumping between multiple tools. 🔁 Four-stage analytical relay (AI automatically switches analysis style—no need to manually change models): 🧹 Data cleaning: automatically handles nulls, outliers, formatting, and duplicates, outputting clean tables 🔬 Deep analysis: descriptive statistics, correlation, attribution, trends, hypothesis testing, with supporting data evidence 📈 Visualization: automatically selects optimal chart types—2–4 core charts explained in one sentence 📝 Report writing: conclusion-first, well-structured analysis reports in Chinese, with actionable recommendations 👥 Use cases: business data analysis, operational reviews, financial reports, user behavior research, academic data exploration—any scenario where you need to turn tables into insights. 💡 Default output is Markdown reports, convertible to Word/PPT. Report style automatically adjusts based on the reader's role (manager/colleague/yourself).

Doc to PPT · Multi-Style
Convert Word documents into professional PPTs with one click. Freely switch between three styles: White Background Business (enterprise data visualization), Minimalist White (clean and efficient presentations), and Green Fresh (notebook infographic style). Automatically recognizes document structure, intelligently extracts titles/data/charts, with full-screen professional design. Suitable for business reports, project proposals, data analysis, and more.
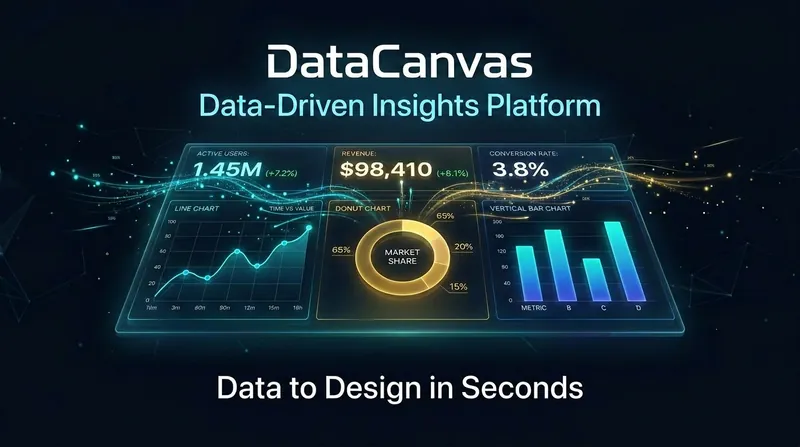
DataCanvas
Data speaks for itself; it just needs a stage. DataCanvas automatically transforms your CSV/Excel/JSON data into professional-grade visual analysis reports. Inspired by the anti-AI aesthetic philosophy of the 11k-star project huashu-design (banning purple gradients, emoji decorations, and bento grids), all charts are hand-coded in pure SVG without relying on any external JS libraries. It includes 6 report templates (Daily/Weekly Operations, Competitor Comparison, User Profiles, Investment Analysis, Free Report) x 5 design styles (Information Architecture, Oriental Minimalism, Swiss Grid, Dark Data, Business Classic), supporting over 20 chart types. From data upload to polished report, everything is automated: data cleaning, statistical analysis, trend insights, chart generation — all in one go.
Information
- Version
- v3
- Last updated
- Runtime credits
- Usage-based
- Models
- Auto