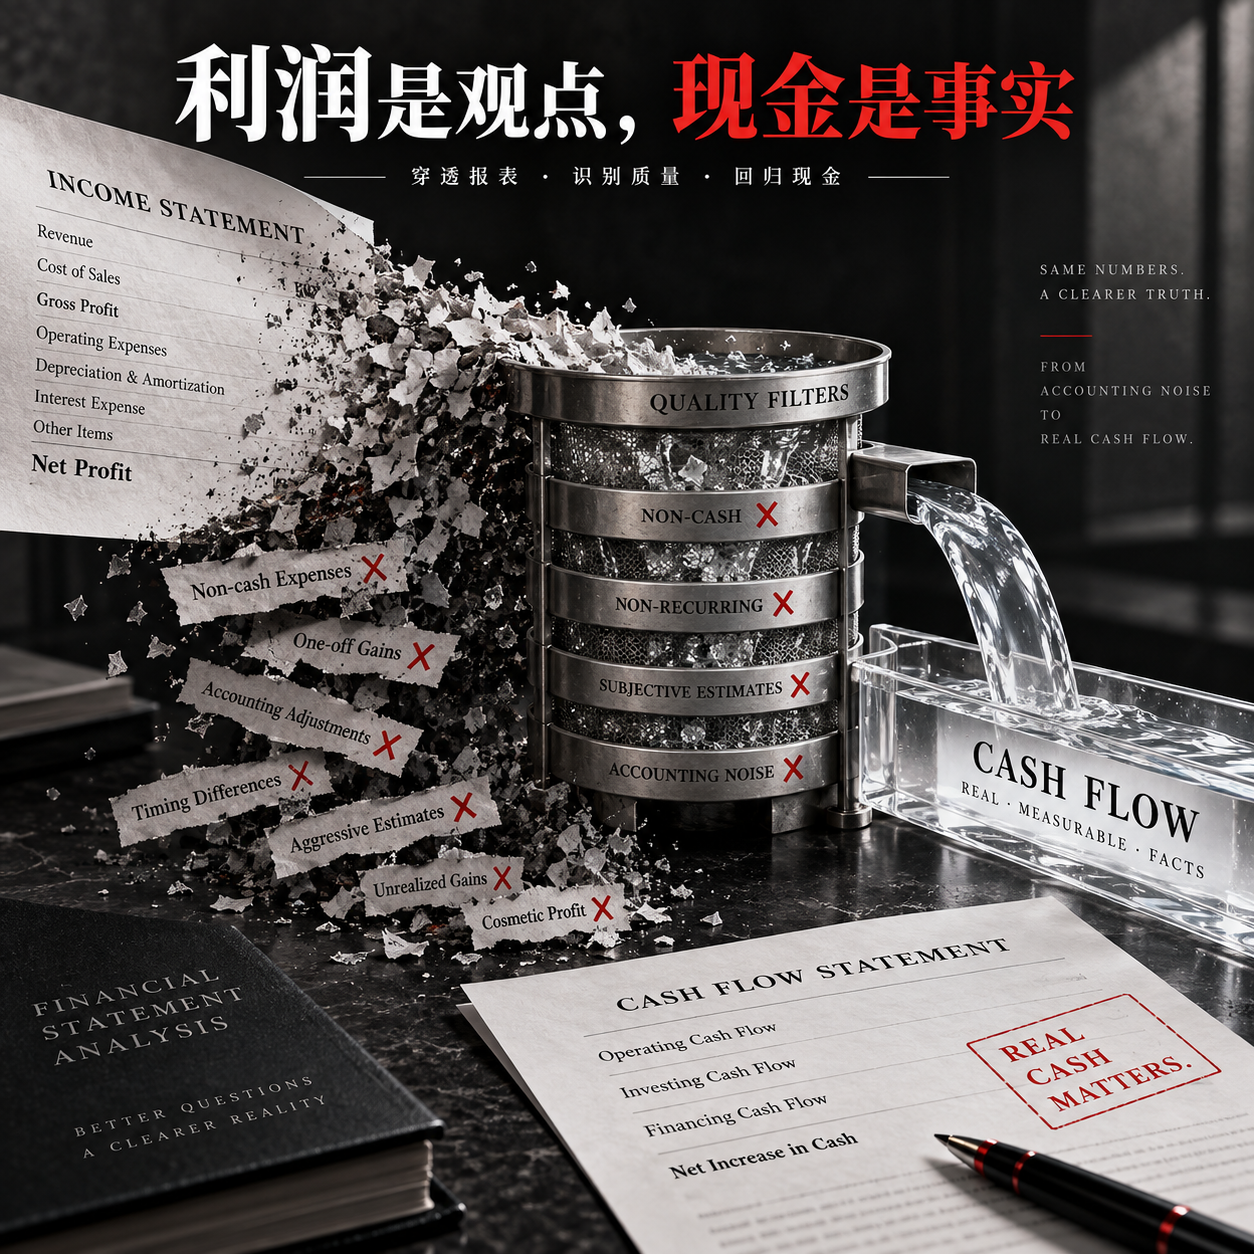
Profit Is Opinion, Cash Is Fact
Unpack cash flow to assess profit quality.
Profit Is Opinion, Cash Is Fact
Unpack cash flow to assess profit quality.
Showcase
Description
Identify the difference between reported profits and real cash, and assess the quality of those profits. | Net profit grows, receivables and contract assets grow faster, and CFO declines | Identify collection and revenue realization risks, but do not directly conclude fraud | | CFO rises sharply, mainly due to increases in payables and customer advances | Distinguish cash flow improvement from cash generated by ongoing operations | | Net profit is negative while CFO is positive | Do not use a conversion rate with a negative denominator to claim “high cash content”; instead, break down the difference | | CFO is steadily positive, but expansion makes FCF negative | Distinguish operating cash flow quality from the pressure of expansion spending | | Only net profit attributable to the parent, cumulative CFO, and a single-period balance sheet are provided | Flag scope and data limitations, perform a limited analysis first, and avoid false precision |
Best for
Financial analysts assessing profit-to-cash conversion, collection risk, and the sustainability of cash flow improvements from financial statements.
How to use this Skill
Provide your input
Provide the company name, analysis period, industry, and questions of interest. If possible, include the income statement, cash flow statement, balance sheet, and relevant notes.
Run the Skill
Compare net profit, operating cash flow, free cash flow, and working capital changes to assess profit realization, cash flow sustainability, and reinvestment pressure.
Review your result
Receive a cash flow quality analysis based on the materials provided, including key findings, evidence limitations, and priority checks—without declaring fraud or giving buy/sell advice.
Related Skills
View all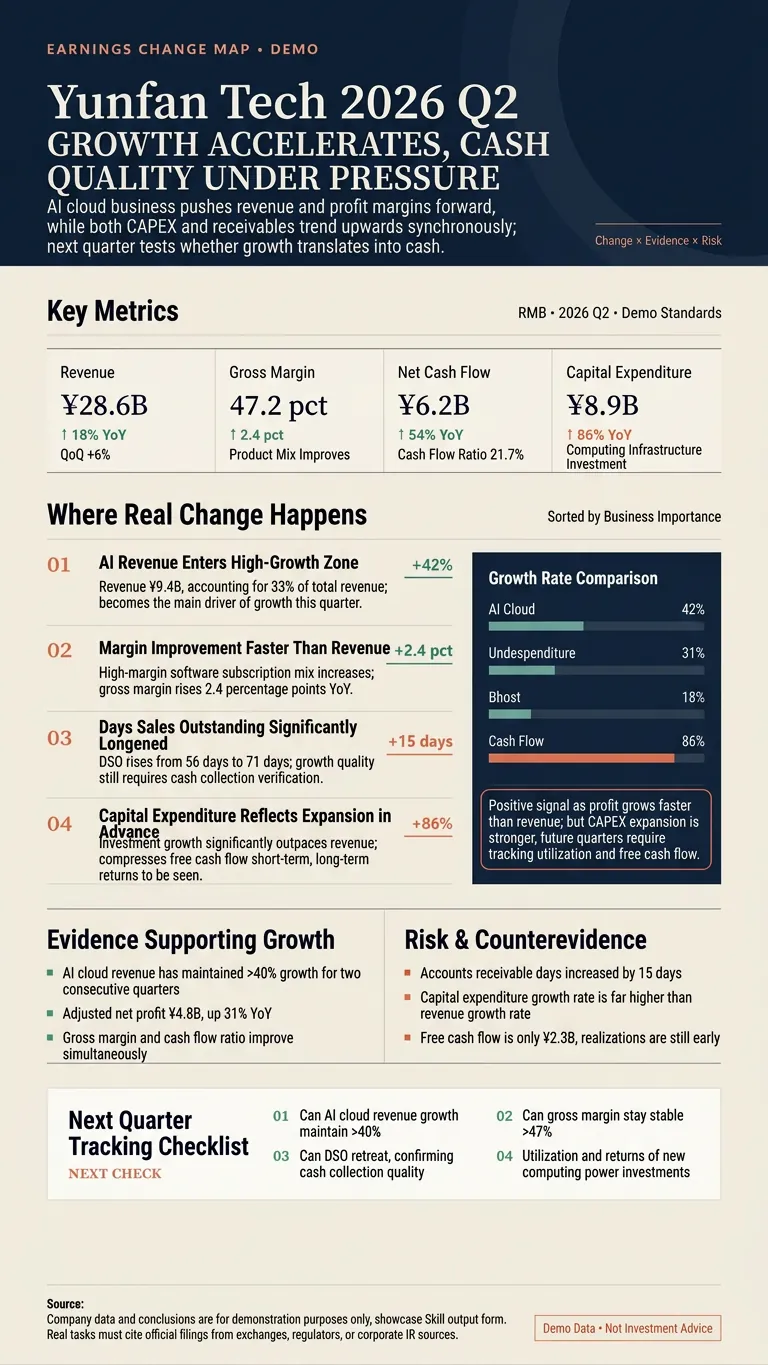
Report Anomaly Graphic
Not a financial report rehash, but identifying where things really changed. Enter the name, ticker, report link, or PDF of an A-share, Hong Kong, or US-listed company. The tool automatically cross-checks official filings, compares key metrics on a like-for-like basis, and identifies growth accelerations or decelerations, margin shifts, cash flow anomalies, one-time items, and changes in management guidance. Each delivery includes: ① Source cards and key metrics table ② The most important report anomalies ③ Supporting evidence and risk checklist ④ Tracking indicators for the next quarter ⑤ A 3:5 or 9:16 investor long graphic ⑥ A ready-to-post short summary You can use it to: • Analyze Tencent's latest report, focusing on gaming, advertising, and capital expenditure • Compare NVIDIA's last two quarters to find accelerating or decelerating metrics • Check Kweichow Moutai's cash flow, contract liabilities, and channel inventory • Verify numbers and conclusions in a stock analysis article, then compile into a graphic All numbers must be traceable to original sources: company announcements, exchange filings, SEC, or company IR. Facts, calculations, and inferences are labelled separately. No fabricated missing data. No buy or sell recommendations. Ideal for investors, financial content creators, researchers, and corporate content teams.
Big Brand ≠ Moat
Identify the types, authenticity, and sustainability of a company’s moat, and build a moat assessment framework. Sample inputs: 6. 【XX公司】Profits have not declined, yet the stock is down 30%. What unreported risks might be hiding behind the financial statements? 7. 【XX公司】It has plenty of cash on the books, so why has the stock fallen so sharply? Is that cash available to save the business, or is it restricted? 8. 【XX公司】It is relying on new share issuance to stay afloat. After such a steep decline, is it still worth considering? Could common shareholders be diluted? 9. The five companies I hold have all fallen significantly recently. Help me identify which ones have not actually suffered fundamental deterioration and are worth deeper research. 10. Help me backtest which companies in 【XX板块】 truly recovered after last year’s major sell-off. Don’t just focus on the survivors.
Information
- Version
- v4
- Last updated
- Runtime credits
- Usage-based
- Models
- Auto
- Use cases
- Research & analysisBusiness & strategyInvestment & finance
- What you get
- Report