Academic Poster Creation
Academic Poster Creation
Showcase
Description
Transform an academic paper PDF end-to-end into an A0 portrait academic poster image. AI adaptively determines the visual style, information density, and color scheme, identifies the paper's "featured anchor points" and presents them prominently. It redraws schematic diagrams, preserves original data charts, and for evidence-based visuals (UI screenshots/chat screenshots), redraws them as UI mockups with a "schematic" label when extraction is not possible. It also identifies and filters out informal layout identifiers such as temporary page numbers from online-first publications. Finally, GPT Image 2 generates a high-quality poster ready for printing and display.
Why we love this skill
This skill intelligently transforms academic papers into high-quality A0 posters. Its unique 'featured anchor identification' and 'chart triage' mechanisms ensure the poster is both rigorous and visually appealing, making it a powerful assistant for academic dissemination.
Related Skills
View all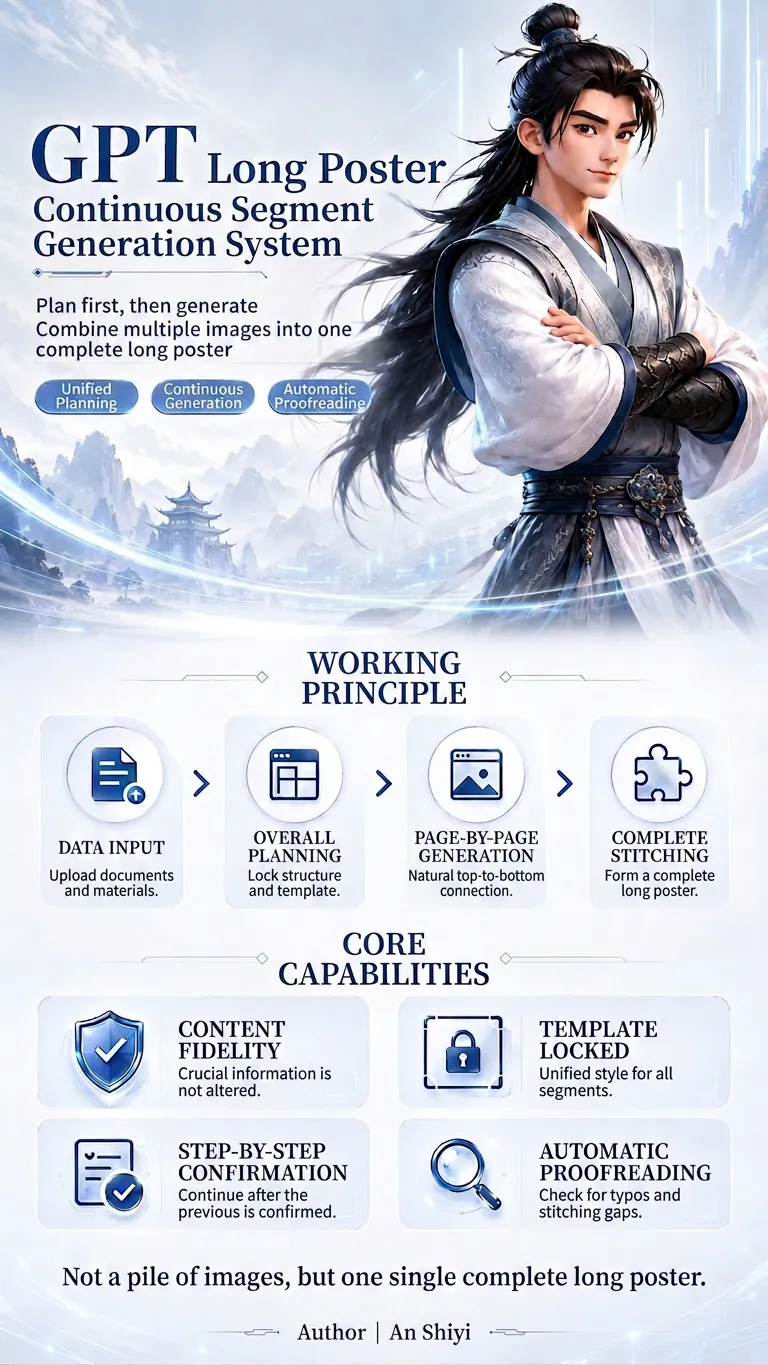 Image
ImageExtra-long Poster Generator
This is a GPT planning and generation system specifically designed for creating continuous extra-long posters. It can identify different tasks such as redesign, partial replacement, and template expansion; extract and protect key information like prices, names, benefits, and dates at varying levels of priority; and then unify the planning of the poster's information flow, segment count, and visual master template. When using it, simply upload your files and assets, and specify the aspect ratio, style, and purpose. The system will first output a complete plan, and after confirmation, generate each segment one by one. It supports content fidelity, master template locking, text whitelisting, segment-by-segment confirmation, automatic proofreading, and seam checking, reducing issues such as inconsistent styles, text errors, duplicated content, and disconnection between sections, ultimately producing a coherent and unified long poster.
 Image
ImageViral Info Atlas Maker
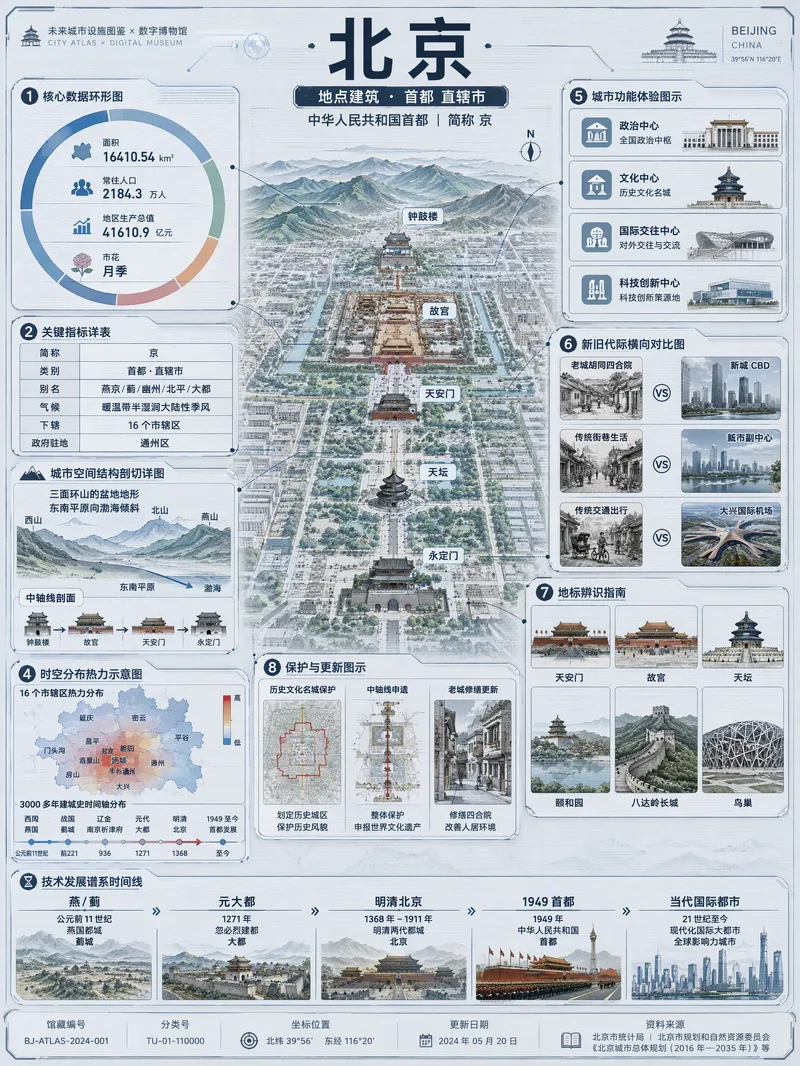
Quickly turn any subject name into a technology-inspired natural history atlas poster that combines rich information with strong visual appeal. Whether it’s a living thing, mineral or material, man-made object, place or building, cultural concept, or historical figure, the Skill organizes content for display and sharing based on your audience, focus, and language requirements. The Skill first uses real-time web research to verify definitions, key data, structure and composition, distribution, applications, evolution, identifying features, and more. It then arranges the content into a 3:4 vertical infographic. The poster centers on a specimen-style subject, surrounded by nine adaptive information modules covering core metrics, structural analysis, spatial and temporal distribution, context and use cases, comparisons, identification points, conservation or maintenance tips, and a development timeline. Module themes and information priorities are adjusted to fit the type of subject. The finished piece uses light gray-blue technical cardstock, precise linework, low-saturation cyan and blue washes, and a semi-transparent scanned texture. The result combines the visual style of a future-city infrastructure atlas with a digital museum display panel, while retaining the subject label at the top and a collection records area at the bottom. For obscure subjects or when information is limited, speculative content is distinguished with visual prompts. It is suitable for science education, exhibition introductions, knowledge sharing, and social media publishing.
 Image
ImageResearch Paper Infographic
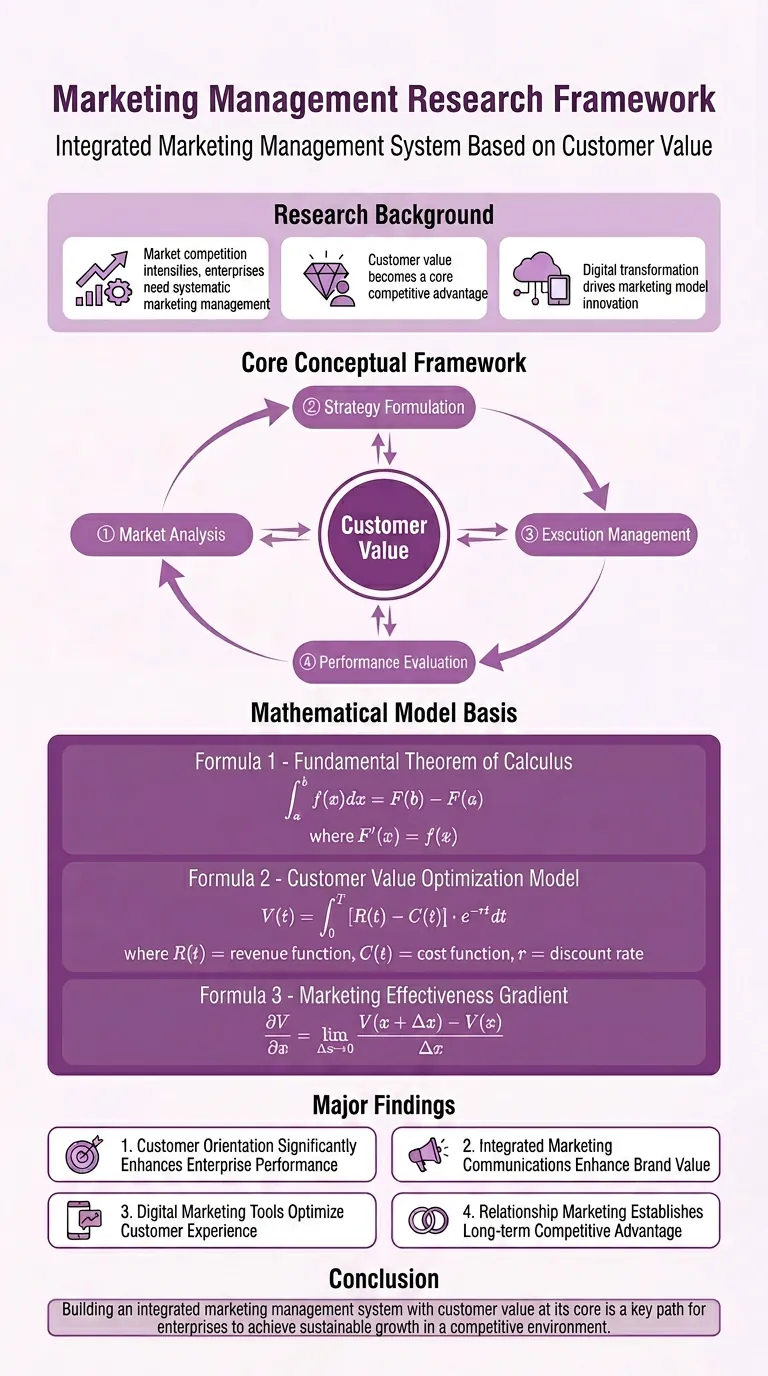
Easily transform your scientific research paper content into professional, high-definition academic infographics. Supports 18 mainstream types, making complex research results clear at a glance. Whether showcasing core mechanisms, experimental workflows, or creating graphical abstracts and technical roadmaps, this tool delivers precise results. We understand the rigor required in scientific illustrations, so beyond visual appeal, we prioritize scientific accuracy to ensure every image is clear and free of misleading information. You can directly provide the full paper, key sections, or a research description, and select the most suitable graph type, such as intracellular mechanism diagrams, tumor immune microenvironment diagrams, material catalysis mechanism diagrams, etc. We also offer a variety of color schemes like blue-green, orange, purple, and chart structure styles like left-label and vertical flow, making your infographics both academically compliant and professionally aesthetic. Beyond traditional academic graph types, this tool also supports 15 creative templates for scientific visualization scenarios, helping you turn research concepts into unique visual works such as magazine-quality posters, interface breakdowns, app design boards, etc., suitable for group meetings, social media, or report covers. We provide a strict controllability checklist and a three-step verification process, and support partial modifications to generated images, ensuring every step closely matches your needs, presenting your research results in the most intuitive and accurate way.
Information
- Version
- v6
- Last updated
- Runtime credits
- Usage-based
- Models
- Auto