
Market Season Indicator
Assess A-shares and sectors by market season
Market Season Indicator
Assess A-shares and sectors by market season
Showcase
Description
Investment judgments go wrong not because you misread a single news story, but because you failed to first identify the environment you are in. The same decline may be mere volatility at the end of summer, but signal accumulating risk at the start of fall. The same positive news can also mean completely different things at different stages. This Skill does not try to predict whether prices will rise or fall tomorrow. Instead, it first answers a more fundamental question: What kind of market environment are we in now? It considers: Valuation levels Sentiment and crowding Policy direction Market behavior The economic backdrop Structural differences between sectors and the broader market It then determines: Which season the market most closely resembles Whether it is in a transition zone between seasons Which evidence supports the assessment Which pieces of evidence conflict Whether recent changes are merely “weather” or significant enough to warrant a reassessment What future developments could invalidate the current assessment It does not reduce the four seasons to a mechanical score, or give falsely precise answers such as “an 82% probability of entering fall.” More importantly, it allows: The broader market and individual sectors to be in different seasons. The overall A-share market may still be at the end of summer, while a highly crowded growth sector already shows signs of fall. Meanwhile, another sector that has been depressed for a long time may just be beginning to thaw at the end of winter. Four typical use cases What season are we in right now? Is the overall A-share market closer to spring, summer, fall, or winter? xiaoxiaodong uses the latest verifiable evidence to assess the environment rather than looking only at today’s price movement. Is today’s sharp drop just weather? More than 4,000 stocks fell today. Does that mean we have entered winter? xiaoxiaodong first determines whether this is a one-day shock, then examines whether the medium-term trend, policy, valuation, and sentiment have also changed persistently. Why can the broader market and sectors be in different seasons? What seasons are the A-share market, AI/compute, and consumer sectors in? xiaoxiaodong assesses them separately instead of copying the broader-market conclusion directly to every sector. Can a single policy announcement really change the market season? Does the central bank’s latest policy mean the market has entered spring again? xiaoxiaodong distinguishes between a one-time event and an ongoing policy direction, and assesses whether the impact is on short-term sentiment or medium-term fundamentals. Example prompts Which season—spring, summer, fall, or winter—is the overall A-share market in right now? Assess the current seasons of the A-share market, AI/compute, and consumer sectors separately. More than 4,000 stocks fell today. Is this just weather, or has the market changed seasons? Trading volume has continued to shrink recently while the indexes remain near their highs. Does this look more like the end of summer or the start of fall? Could the central bank’s latest policy change the current market season? Why are the indexes still rising while most stocks have become harder to profit from? What it does not do: Precisely predict market tops and bottoms; Give a specific date for a seasonal transition or a falsely precise probability; Provide individual stock price targets or precise buy and sell points; Recommend personalized portfolio allocation percentages; Force a seasonal conclusion when the evidence is insufficient. It is a market-environment assessment tool, not a market-timing prediction tool.
Related Skills
View all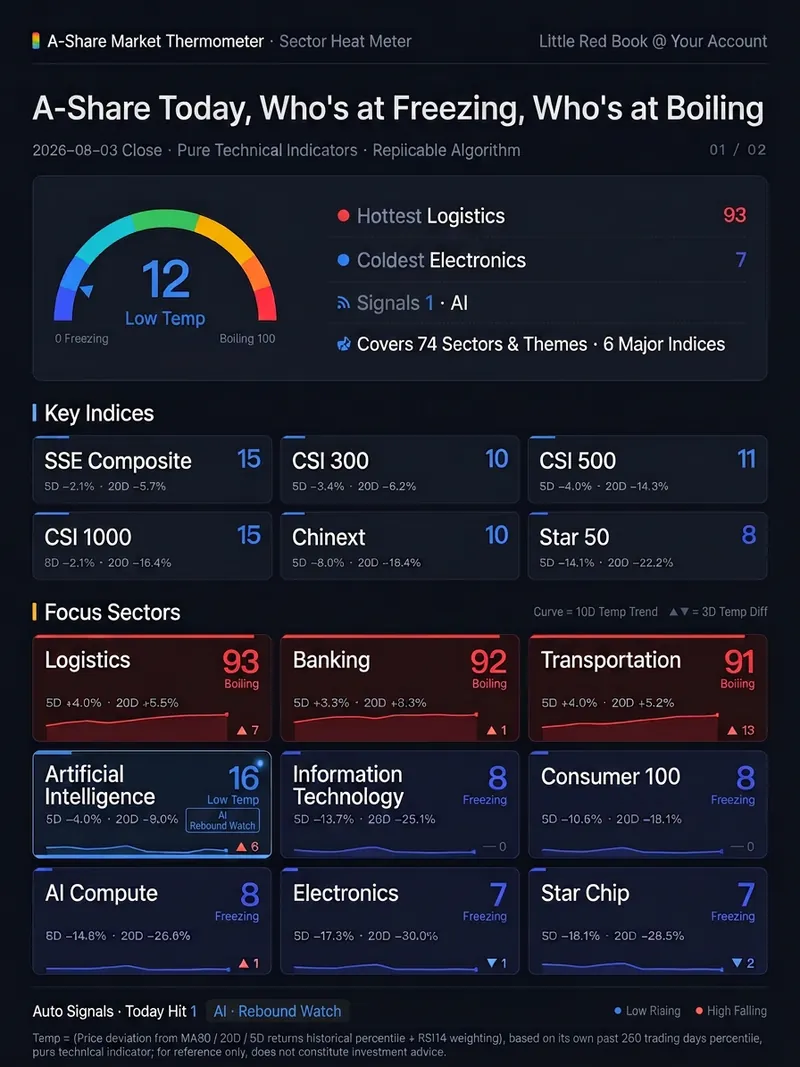
A-Share Market Thermometer
One command after the close delivers **a web page that does the calculation itself**: within 1–2 seconds of opening, it concurrently pulls 80 daily K-line data points in your own browser, scores the 6 major A-share indices plus 74 industries and themes on a 0–100 temperature scale, and renders the results as a two-page, 1080px-wide dashboard long image—ready to screenshot for Xiaohongshu or WeChat Official Account. Data goes through no intermediary and doesn't rely on an author-provided data source—your browser connects directly to the market data interface. So every time you open it, you get the latest live market data, not a static image that expires the next day. The temperature isn't “AI intuition”—it's a formula hard-coded in the page source. For the three factors—price deviation from MA60, 20-day returns, and 5-day returns—each one takes its own historical percentile over the past 250 trading days, and then RSI14 weighting is added. It uses percentiles rather than absolute gains/losses because banks may move 20% a year while theme sectors move 200%; only by converting to each one's historical position can they be compared on the same scale. Real example: on the same day, the finance & real estate and green power sectors had nearly identical 5-day and 20-day gains and sat right next to each other in the gain rankings. But their temperatures were 87 (high heat) and 50 (neutral)—because the former had risen above MA60 and hit its hottest level in a year, while the latter was just a small rebound after a deep drop. Seven qualitative levels: Ice Point / Low Temperature / Slightly Cool / Neutral / Warming / High Heat / Boiling Point. Automatic signals: temperature ≤20 and a rise of ≥5 degrees in the past 3 days = rebound watch; temperature ≥80 and a drop of ≥5 degrees in the past 3 days = pullback watch. Thresholds are hard-coded; if none are hit, it reports zero—it doesn't force a match. All 80 are publicly released CSI/CNI standard indices, with the code list hard-coded in the page. The algorithm is in the source code—you can inspect and reproduce it yourself. The same closing data always produces the same number no matter who runs it. It only measures temperature for indices and sectors, not individual stocks. It only presents hot/cold distributions and pattern signals; it does not recommend stocks, predict price movements, or constitute investment advice. Trigger words: market temperature / A-share thermometer / sector temperature / sector heat / market sentiment / sentiment indicator / is the market cold today / freezing point / boiling point / market overview / sector rotation / post-close review / temperature dashboard / market thermometer

Self-Evolving A-Share Rotation
This skill provides A-share investors with a comprehensive strategy management and evolution platform, helping you systematically execute, validate, and optimize your trading strategies. It can intelligently adjust your monthly rebalancing strategy based on market conditions, and through rigorous backtesting, continuously evaluate strategy performance and provide in-depth diagnostics to ensure your investment approach stays in sync with the market. Using real-time market data analysis, this skill accurately identifies the current market environment (such as trending, range-bound, or bear markets) and applies preset parameter sets for stock screening. It employs a multi-layer funnel approach, starting with fundamental hard metrics to technical timing, then rigorous individual stock value analysis, and actively seeks counterevidence to avoid blind decisions. Ultimately, you receive an auditable candidate stock list, each with detailed rule-hit explanations, ensuring transparent and traceable decisions. Beyond strategy execution, this skill also offers powerful strategy validation and evolution capabilities. It automatically tracks and backfills your trading signal performance, generating detailed strategy health reports including win rate, profit/loss ratio, and excess returns over the CSI 300. When a strategy underperforms, it intelligently triggers evolution suggestions, performs attribution diagnostics to identify problematic rules, and supports parameter adjustments after paper trading validation to continuously refine your investment strategy. Notably, after each strategy execution or validation, this skill scans US, Hong Kong, and A-share markets to provide 'cross-market high expected value opportunities' with structural advantages. These opportunities are based on a rigorous expected value framework and come with clear entry, stop-loss, target, and position suggestions, but are not automatically written to your trading log. They serve as decision support references, helping broaden your investment perspective.
High-Growth Stock Hunter
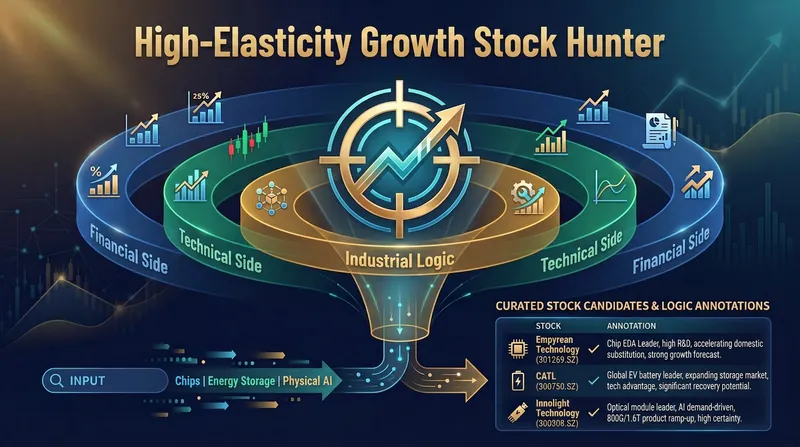
In a bull market, the most expensive thing isn't stocks—it's not knowing what to buy. This isn't fearmongering. It's the lesson the A-share market taught every retail investor in the first half of 2026. Chips are up 50% while you're holding cash. Energy storage has rallied three times while you're still flipping through Xueqiu posts. Stocks in the CXMT supply chain have already doubled, and you can't even name the upstream material companies. It's not that you lack courage—you lack a framework. Buy on tips, sell on feelings, pick stocks based on 'I heard XX is doing well.' That strategy might work in a range-bound market, but in a structural bull market, you're watching others feast while you can't even get a sip of soup. What is the High-Growth Stock Hunter? It's a stock-picking Skill that takes a sector keyword and automatically screens for high-growth A-share candidates. The core is a three-layer filter: Layer 1: Financials Eliminates pure hype. Only stocks that pass hard metrics—revenue growth rate, gross margin, R&D investment—move to the next round. No pump-and-dump stocks, no junk stocks, no pie-in-the-sky stories. Layer 2: Technicals Looks only at price-volume structure. Keep stocks that break out on volume from the bottom, discard those with high-volume bearish candles. Don't be the sucker buying at the top. Layer 3: Industry Logic This is the toughest layer. Candidates must be at key nodes in the supply chain—either upstream selling shovels or midstream bottlenecks. No downstream assemblers, no pure distributors, no story-driven turnarounds. After all three layers, what comes out isn't 'stock recommendations'—it's a candidate pool with selection logic. For every selected stock, you can see: why it's here, the logic behind it, and where the risks lie. Who needs this? If you fit any of the following: * You know a sector is about to take off but don't know which stocks to pick * You read three research reports and ended up more confused because each one recommends different stocks * You've bought chips, new energy, and innovative drugs—but bought each wave at the peak * Your portfolio is full of 'friend's tips' and 'influencer picks,' none of which you selected yourself * You believe there are still opportunities in A-shares, but you need a logic you can understand and reuse, not the next code someone feeds you Then this Skill is for you. Why the price tag? 1,999 credits—not cheap. But do the math: one impulsive chase-the-top trade will cost you more than that. Missing one high-conviction opportunity will lose you more than that. Spending three hours reading all the reports will cost you more than that in time. This Skill doesn't give you a single stock—it gives you a reusable hunting framework. Use it once and you're breakeven. Use it ten times and you start to build judgment. One final truth: The bull market won't wait for you. But it doesn't reward impulsiveness either. It rewards those who pick the right direction, the right stocks, and the right timing. The High-Growth Stock Hunter doesn't guarantee you win every time—nothing can. But it guarantees that next time you make a move, you'll have a map in hand, logic in your eyes, and calm in your heart. Ready to enter the game? Let the hunter take you into the woods.
Information
- Version
- v5
- Last updated
- Runtime credits
- Usage-based
- Models
- Auto