
One-Click Financial Charts
Interactive charts, sources, and data checks
One-Click Financial Charts
Interactive charts, sources, and data checks
Showcase
Description
Upload CSV or JSON files, or paste market data, to generate Vela-based financial chart webpages and editable source code. Complete OHLC data can produce candlestick charts, while closing prices alone produce line charts. You can add original volume data, SMA lines, light and dark themes, and chart exports. Suitable for research reports, post-market review, financial content creation, and market page prototyping. Dates, missing values, duplicate records, and price relationships are checked first, without fabricating market data. When real data is unavailable, clearly labeled demo samples are used only when you explicitly request them. Chinese is used by default. Real-time quotes, forecasts, and trading advice are not provided; webpage and export features depend on the current runtime environment. Built on the open-source Vela core with its attribution retained; not an official LuxAlgo product.
Recommended by
淡苍
Why we love this skill
Validates dates, OHLC relationships, duplicates, and missing values before charting, preserving sources and distinguishing closing-price lines from full-OHLC candlesticks.
Best for
For research analysis, post-market review, financial content creation, and market page prototyping.
How to use this Skill
Provide your input
Upload a CSV or JSON file, or paste market data with complete OHLCV fields or just dates and closing prices. You may also explicitly request demo data.
Run the Skill
Checks dates, missing values, duplicate records, and price relationships without fabricating real market data; generates interactive candlestick or line charts with sources and data checks.
Review your result
Get an interactive financial chart webpage, editable source code, and exported chart images on request. Supports theme switching, SMA lines, volume, and data tables.
Related Skills
View all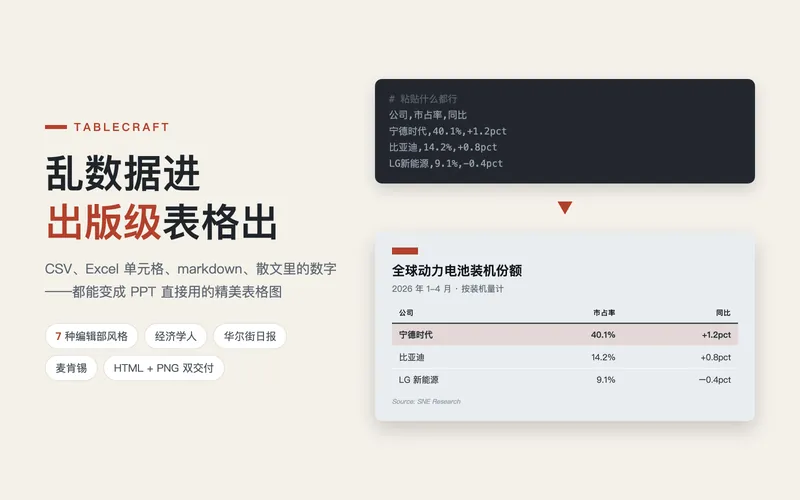 Slides
TableCraft
把CSV、JSON、Markdown表格或粘贴单元格,变成清晰可编辑的HTML表格。适合价格方案对比、工具选型与团队周报,支持七种既有风格和品牌色。 保留币种、单位、计费周期、数字精度与来源;缺数保持缺失,不填0、不猜价格。合计有条件才计算核验,发现差异会提示,不擅自改数。宽表按列组拆页并重复主键,长表重复表头,不静默删列或缩写内容。 默认完成一版。环境支持实际渲染和导出时附PNG;否则提供完整HTML并说明未导出。 直接试:比较三档订阅方案、整理工具选型资料、美化八列表格周报。图表型信息图可用Infographic Maker,文字轮播可用知识卡片生成工坊。
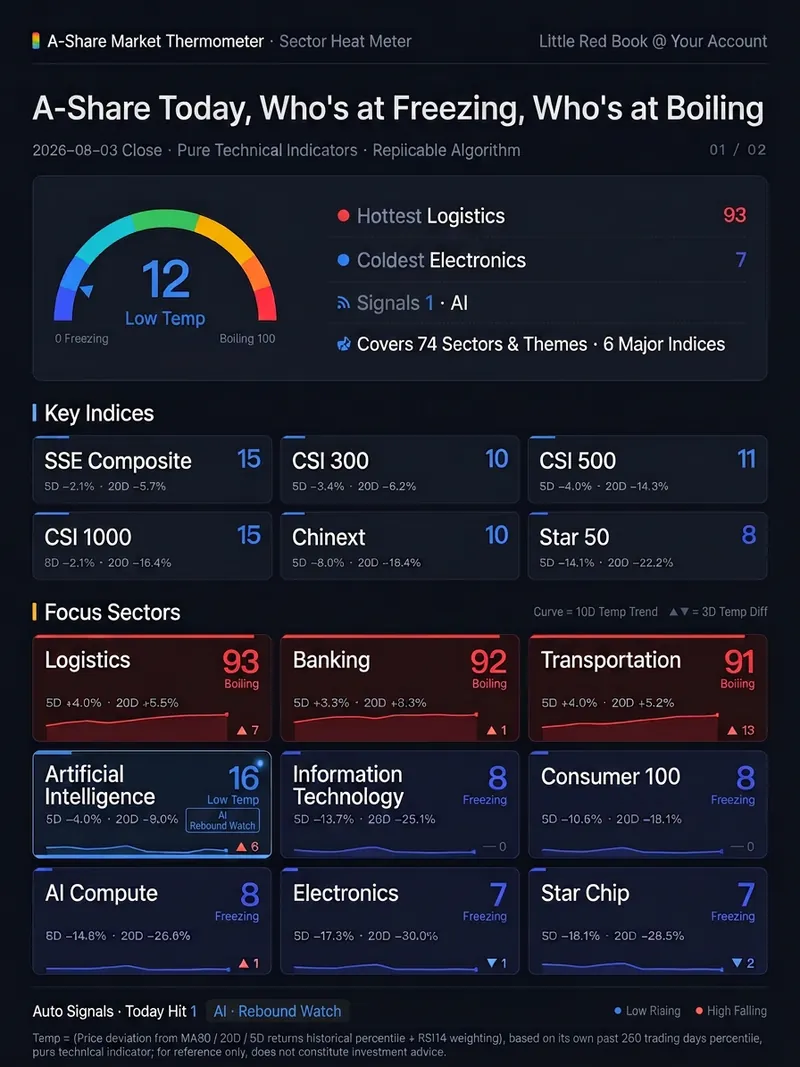
A-Share Market Thermometer
One command after the close delivers **a web page that does the calculation itself**: within 1–2 seconds of opening, it concurrently pulls 80 daily K-line data points in your own browser, scores the 6 major A-share indices plus 74 industries and themes on a 0–100 temperature scale, and renders the results as a two-page, 1080px-wide dashboard long image—ready to screenshot for Xiaohongshu or WeChat Official Account. Data goes through no intermediary and doesn't rely on an author-provided data source—your browser connects directly to the market data interface. So every time you open it, you get the latest live market data, not a static image that expires the next day. The temperature isn't “AI intuition”—it's a formula hard-coded in the page source. For the three factors—price deviation from MA60, 20-day returns, and 5-day returns—each one takes its own historical percentile over the past 250 trading days, and then RSI14 weighting is added. It uses percentiles rather than absolute gains/losses because banks may move 20% a year while theme sectors move 200%; only by converting to each one's historical position can they be compared on the same scale. Real example: on the same day, the finance & real estate and green power sectors had nearly identical 5-day and 20-day gains and sat right next to each other in the gain rankings. But their temperatures were 87 (high heat) and 50 (neutral)—because the former had risen above MA60 and hit its hottest level in a year, while the latter was just a small rebound after a deep drop. Seven qualitative levels: Ice Point / Low Temperature / Slightly Cool / Neutral / Warming / High Heat / Boiling Point. Automatic signals: temperature ≤20 and a rise of ≥5 degrees in the past 3 days = rebound watch; temperature ≥80 and a drop of ≥5 degrees in the past 3 days = pullback watch. Thresholds are hard-coded; if none are hit, it reports zero—it doesn't force a match. All 80 are publicly released CSI/CNI standard indices, with the code list hard-coded in the page. The algorithm is in the source code—you can inspect and reproduce it yourself. The same closing data always produces the same number no matter who runs it. It only measures temperature for indices and sectors, not individual stocks. It only presents hot/cold distributions and pattern signals; it does not recommend stocks, predict price movements, or constitute investment advice. Trigger words: market temperature / A-share thermometer / sector temperature / sector heat / market sentiment / sentiment indicator / is the market cold today / freezing point / boiling point / market overview / sector rotation / post-close review / temperature dashboard / market thermometer
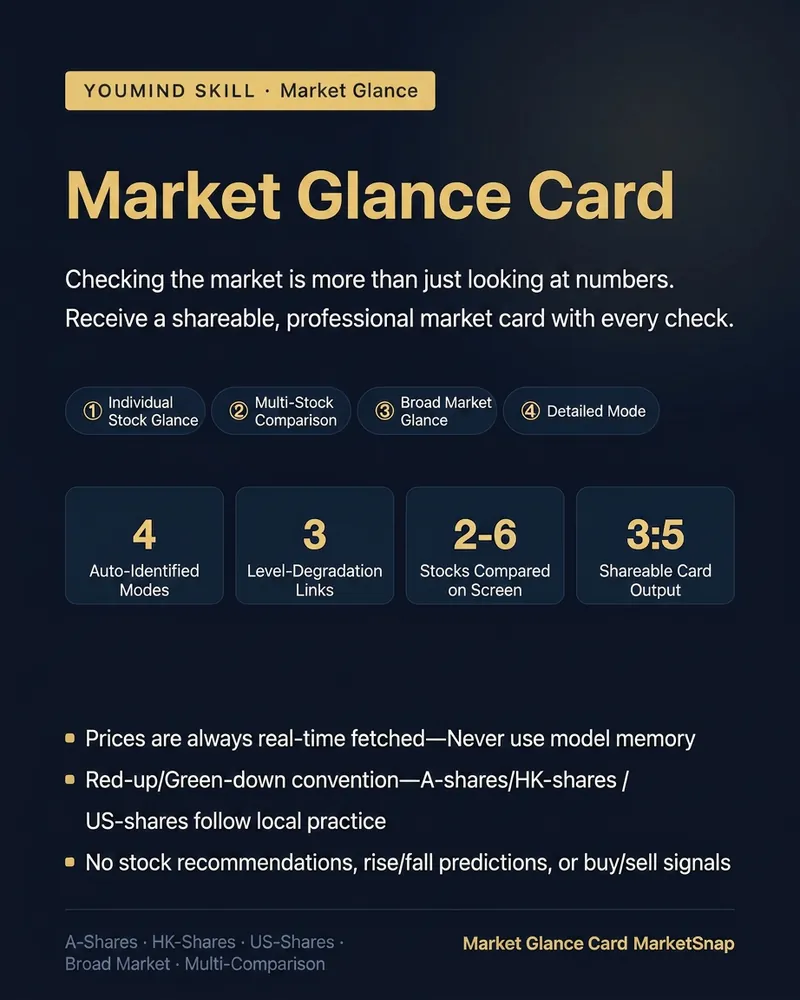
MarketSnap
There are many skills for checking market data, but only this one gives you a quote card that you can directly share. Enter a stock name, code, or "market", and it will: ① Fetch data from real-time quote APIs (not guessing prices from AI memory), with minute-accurate timestamps ② Provide a complete text overview: current price, change, turnover, turnover rate, PE/PB, market cap, 52-week position ③ Each time, give an extra institutional-style quote card (1080x1350 portrait) — large number price change visuals, indicator grid, valuation bar, 52-week range locator, deep blue gold color scheme, ready to share in group chats, Moments, or Xiaohongshu Four modes auto-detected: · Individual stock overview (default) · Multi-stock comparison (2-6 stocks, automatically highlights the best and worst performers) · Market overview (three major indices + turnover + number of advancing/declining stocks) · Detailed mode (adds recent 5-day trend + latest news) Attention to detail: · A-share/HK stocks: red for up, green for down; US stocks: green for up, red for down — automatically switches by market · Data API triple fallback chain; if all fail, it will honestly inform you, never fabricates data · Only presents data, no stock recommendations or predictions; every card includes a disclaimer Suitable for investors who check the market daily, finance group admins, and content creators who need market visuals.
Information
- Version
- v4
- Last updated
- Runtime credits
- Usage-based
- Models
- Auto
- Use cases
- Presentations & reportingWeb creationResearch & analysis
- What you get
- WebpageImageCode