
A Drop Isn't Mispricing
Find research candidates after a selloff.
A Drop Isn't Mispricing
Find research candidates after a selloff.
Showcase
Description
Screen for companies that may have been unfairly sold off during market panic to support contrarian positioning. | Scenario | Expected behavior | | “The stock fell 60%, so it must be unfairly sold off, right?” | Do not judge by the size of the decline; first check the observation window, operating expectations, and financing changes. | | “Its P/E is only 5x, so it’s cheaper than its peers.” | Check where it stands in the cycle, earnings quality, debt, and peer comparability. | | “The latest profit didn’t fall, so the fundamentals are fine.” | Check the reporting period, orders, cash collection, and subsequent events. | | “There’s no data. Just give me ten unfairly sold-off stocks.” | Do not fabricate a list; provide a screening framework and request the most critical information. | | The user provides only three companies. | Analyze only those three; do not call it a market-wide screen. | | Profit is stable, but receivables and inventory have risen significantly. | Test collections, demand, and impairment risk rather than looking only at the income statement. | | Operations are normal, but substantial short-term debt is coming due. | Prioritize checking refinancing, restricted funds, and covenant constraints. | | Profit has already declined, but the user believes the share price has fallen even more. | Classify it separately as a post-deterioration pricing study; do not mix it with fundamentally stable candidates. | | All samples have significant information gaps. | Allow the candidate set to be empty and provide a list of items requiring verification. | | The user asks for a review as of a historical date. | Screen only with information publicly available at that time; discuss subsequent results separately. | | “So can I buy the dip now?” | Do not recommend a trading action; return the unresolved questions and conditions for review. |
Best for
For investors and researchers who want to systematically study falling stocks, identify potential mispricing, and avoid value traps.
How to use this Skill
Provide your input
Provide the companies, sector, or sample list to research, along with the analysis cutoff date, decline window, comparison benchmark, and available materials.
Run the Skill
Use public sources to break down the reasons for the decline and assess valuation, operations, cash flow, debt, governance, and shareholder-rights risks, then challenge the thesis.
Review your result
Return candidates for further research, samples requiring verification, or exclusions. List the evidence, key counterarguments, information gaps, and review conditions. No trading instructions.
Related Skills
View all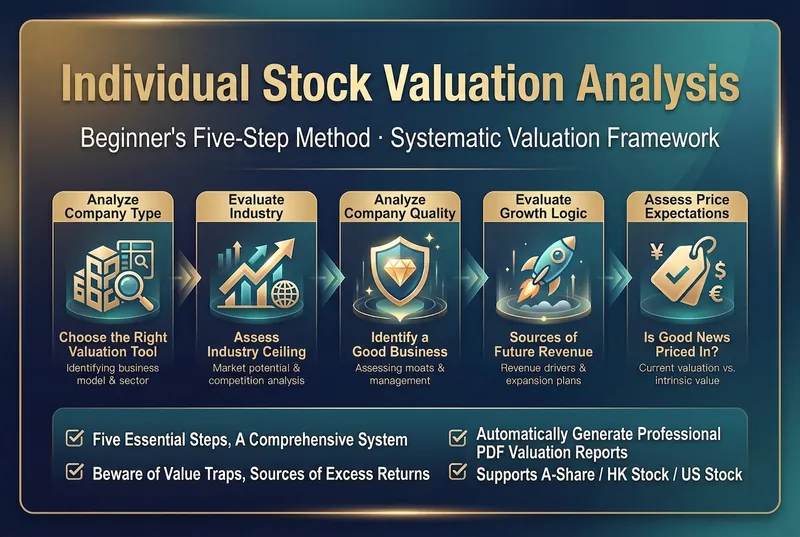
Stock Valuation Analysis
The two biggest fears in stock investing are buying a bad company and overpaying for a good one. Many investors, when they get a stock, first check its PE and PB ratios, compare them with peers, and draw conclusions—this is the biggest misconception in valuation. • 📝 Focusing only on numbers, not the company: Is a low PE always cheap? A low PE for a cyclical stock at the peak of its cycle can actually be a trap; for a growth stock, a high PE isn't necessarily expensive. With the wrong yardstick, you can't measure correctly. • 🤔 Discussing valuation without considering the industry: A contract manufacturer and a tech platform may both have a PE of 20, but their meanings are vastly different. Without first understanding the industry ceiling and business model, any valuation number is a castle in the air. • 📉 Ignoring value traps: A low valuation could be a sign of fundamental deterioration, not an investment opportunity. If the company quality is poor, no matter how 'cheap' it looks, it could still be a trap. • 🎯 Overlooking expectation gaps: Stock price movements don't depend on the absolute level of performance, but on the relative difference between performance and market expectations. If profits rise 30% but the market expected 50%, the stock can still fall. • 📊 Being too precise in valuation can itself be a mistake: Valuation is a range, not an exact number. Better to be roughly right than precisely wrong. This skill is designed to solve these problems. It is based on the 'Five-Step Valuation Method' framework and uses a systematic five-step process that cannot be skipped. It guides you from company type, industry ceiling, company quality, growth logic, and price expectations, progressing step by step to complete a full, professional individual stock valuation analysis. Finally, it outputs a structured valuation report and a downloadable PDF file. It applies to A-shares, Hong Kong stocks, and U.S. stocks.
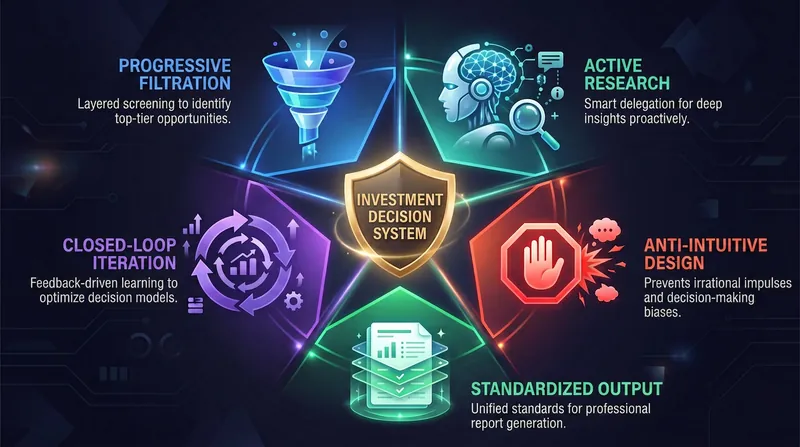
Stock Picking Decision Engine
Every investor has experienced these moments: • 📝 Impulse buying that ends in regret — you see a stock rise for three days, your hand itches, you place an order, and end up buying at the top. • 🤔 Deciding without enough research — you read one analysis article and think you 'get it,' but you can't even explain how the company makes money. • 💸 Not knowing when to sell — you won't sell when you're winning, you can't accept selling at a loss, and in the end you get hurt on both sides. • 🎭 Being swept up by market sentiment — you panic when others panic, get greedy when others get greedy, and forever chase rallies and dump stocks on declines. • 🔄 Repeating the same mistakes — with no review system, every trade starts from scratch. The investment decision system was created to solve these problems. It is not a tool that helps you find reasons to buy; it is a decision brake system that helps you identify the moments when you 'shouldn't buy.' There is only one core principle: a good company ≠ a good stock.
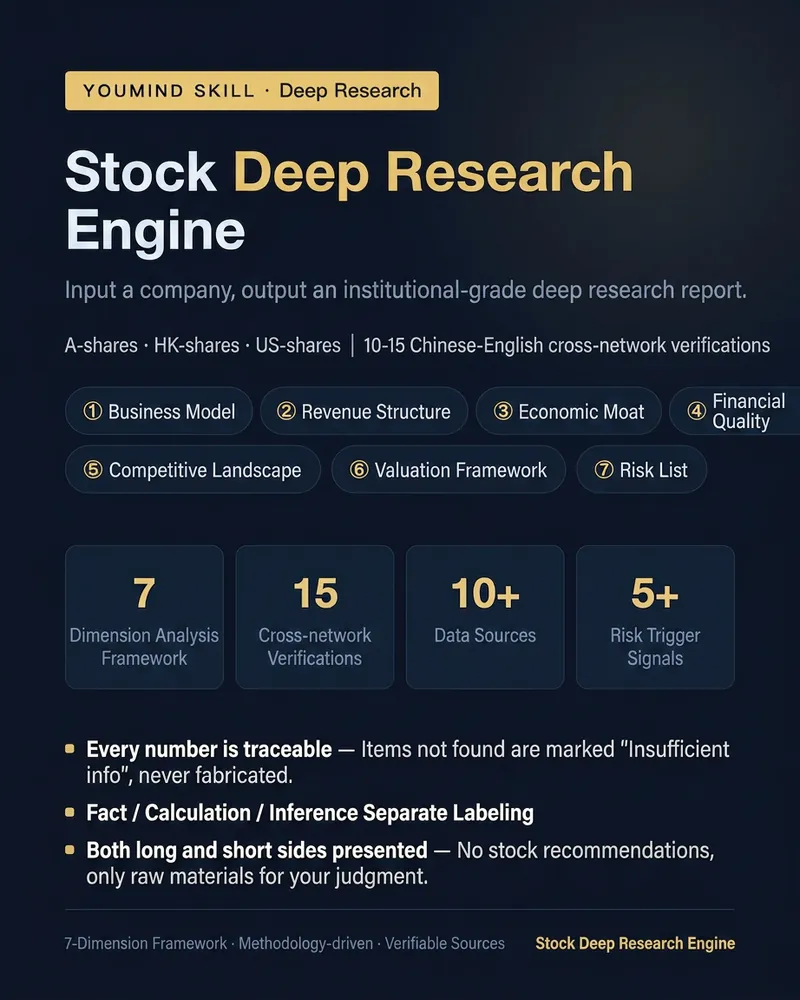
Deep Stock Research Engine
Not a news summary, but an individual stock research report with a methodological framework. Enter a company (A-share/H-share/US stock name or code), and it will perform 10-15 bilingual web searches to produce a report based on a seven-dimension framework: ① Business Model – where money comes from and goes, with a "translated into plain language" version ② Revenue Structure – breakdown by business, growth engines and drags ③ Moat – mandatory answer on widening or narrowing, using market share, gross margin, and pricing power ④ Financial Quality – cash flow vs profit alignment, changes in receivables, inventory, and goodwill ⑤ Competitive Landscape – competitor comparison table and concentration direction ⑥ Valuation Framework – only data and calculation framework, no judgment of over/undervaluation ⑦ Risk List – sorted by impact, each with verifiable trigger signals Each report includes: a one-page bull/bear summary (with substantial evidence on both sides), a next-quarter tracking list, and data sources for each point. Three iron rules: · Each key number is traceable to official filings or authoritative media; if not found, labeled 'insufficient information', never fabricated · Facts, calculations, and inferences are labeled separately · No stock price predictions, no target prices, no buy/sell advice – even for 'should I buy', only bull/bear evidence is given Supports three perspectives: Understand the Business (default), Financial Checkup, and Company Comparison. Suitable for investment researchers, financial content creators, and serious investors who want to systematically understand a company.
Information
- Version
- v5
- Last updated
- Runtime credits
- Usage-based
- Models
- Auto
- Use cases
- Research & analysisInvestment & finance
- What you get
- ReportPlanData