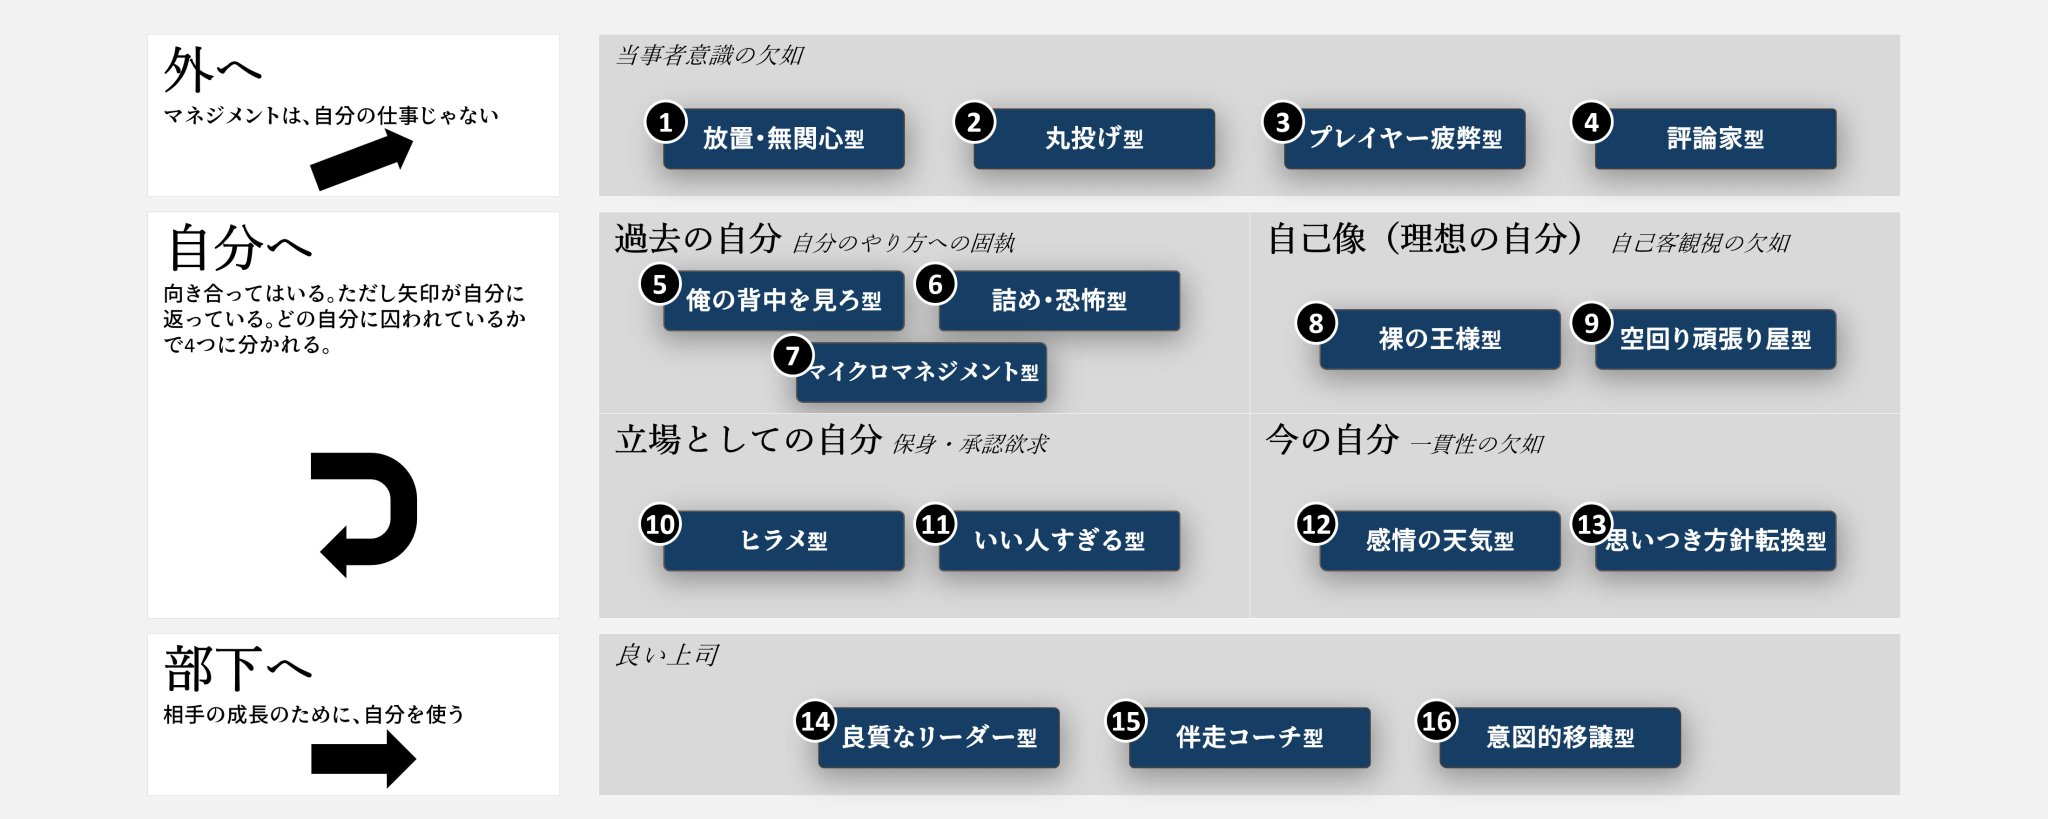
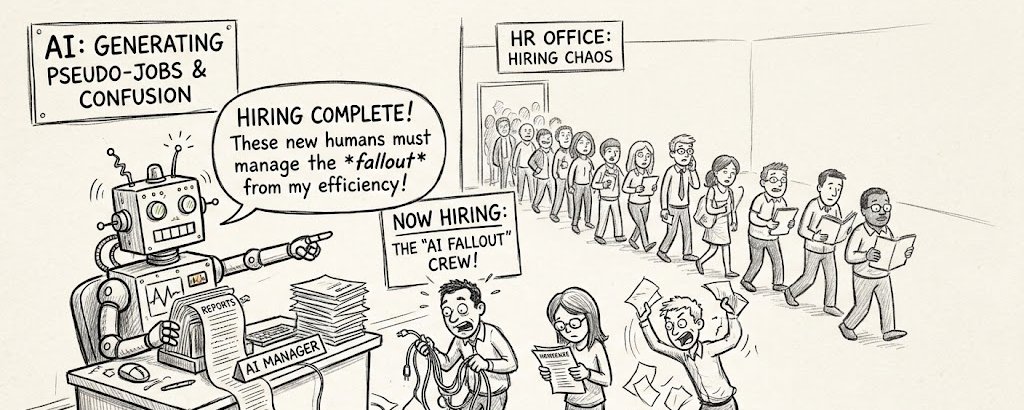
Recently, I've been acting as a "wishing well turtle."
I've created a set of "McKinsey-style prompts" for the community members.

This set of prompts is quite special ✨
Beyond daily uses like 𝕏 covers and poster covers,
It's suitable for business/academic scenarios: infographics, consulting analysis pages, methodology diagrams, flowcharts, and matrix diagrams.
The overall direction is:
McKinsey-style rational temperament, high-end consulting report visuals, text-led, visual metaphors, title information reconstruction, minimalist business graphics, and clear business narratives.
Key point!! ‼️‼️ This set of prompts will automatically distinguish between cover logic and infographic logic based on different uses.
When making covers, it emphasizes simplicity, white space, core keywords, business metaphors, and title reconstruction.
When making infographics, it emphasizes structure, modules, reading paths, hierarchical relationships, and conclusion expression.
Suitable for friends who want to create high-end business visuals, consulting-style covers, methodology diagrams, and strategic analysis pages for direct reuse.
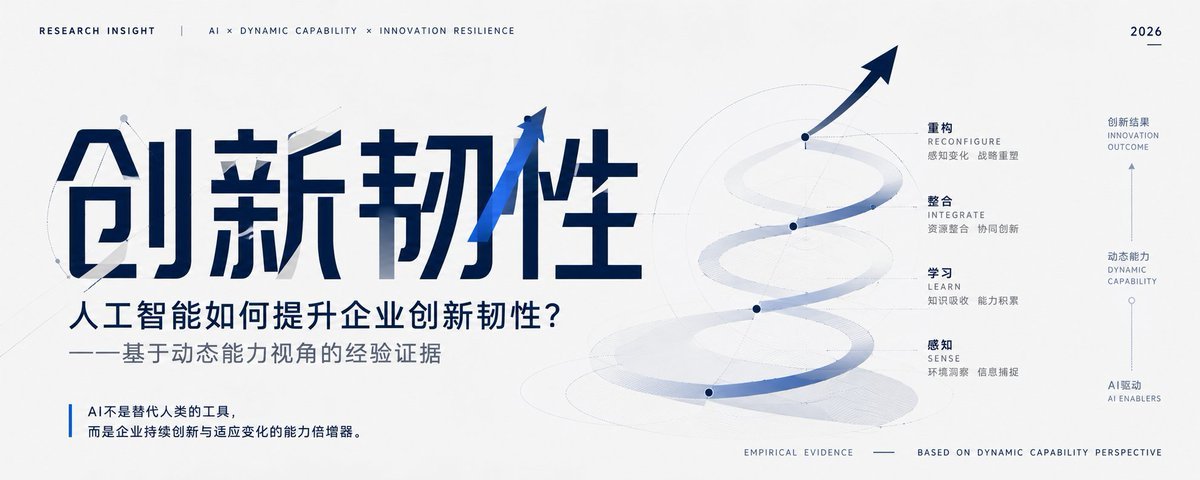
Example: Academic paper PPT cover image
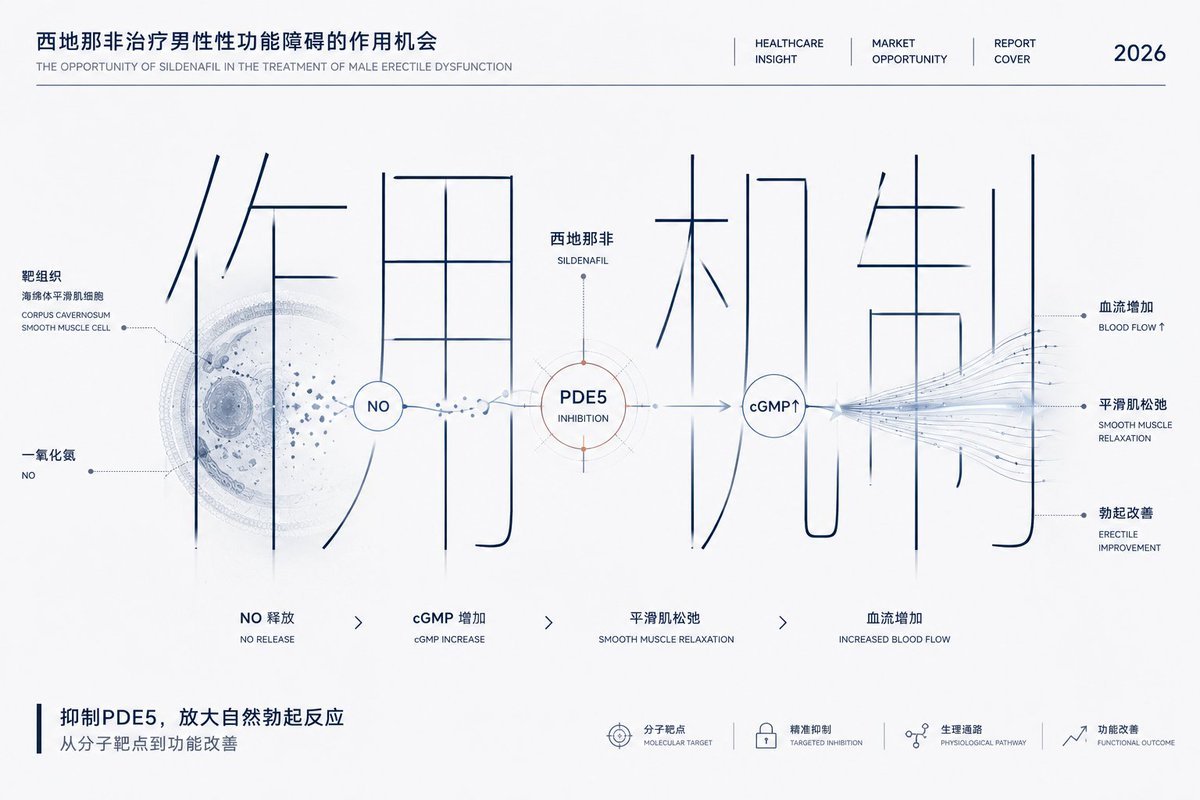
Example: Academic research instance diagram

Example: Theme poster
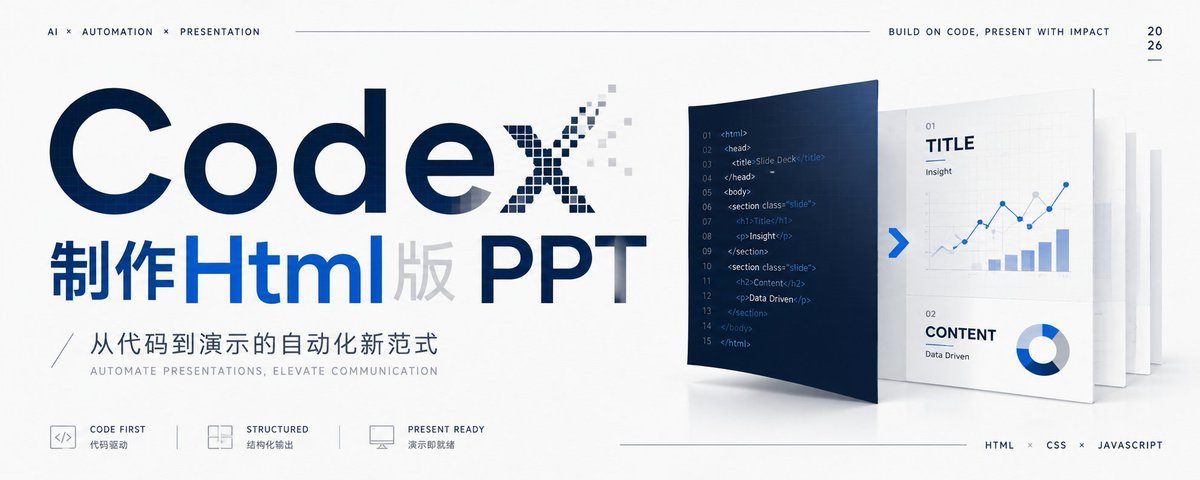
Example: 𝕏 Cover — Tutorial category
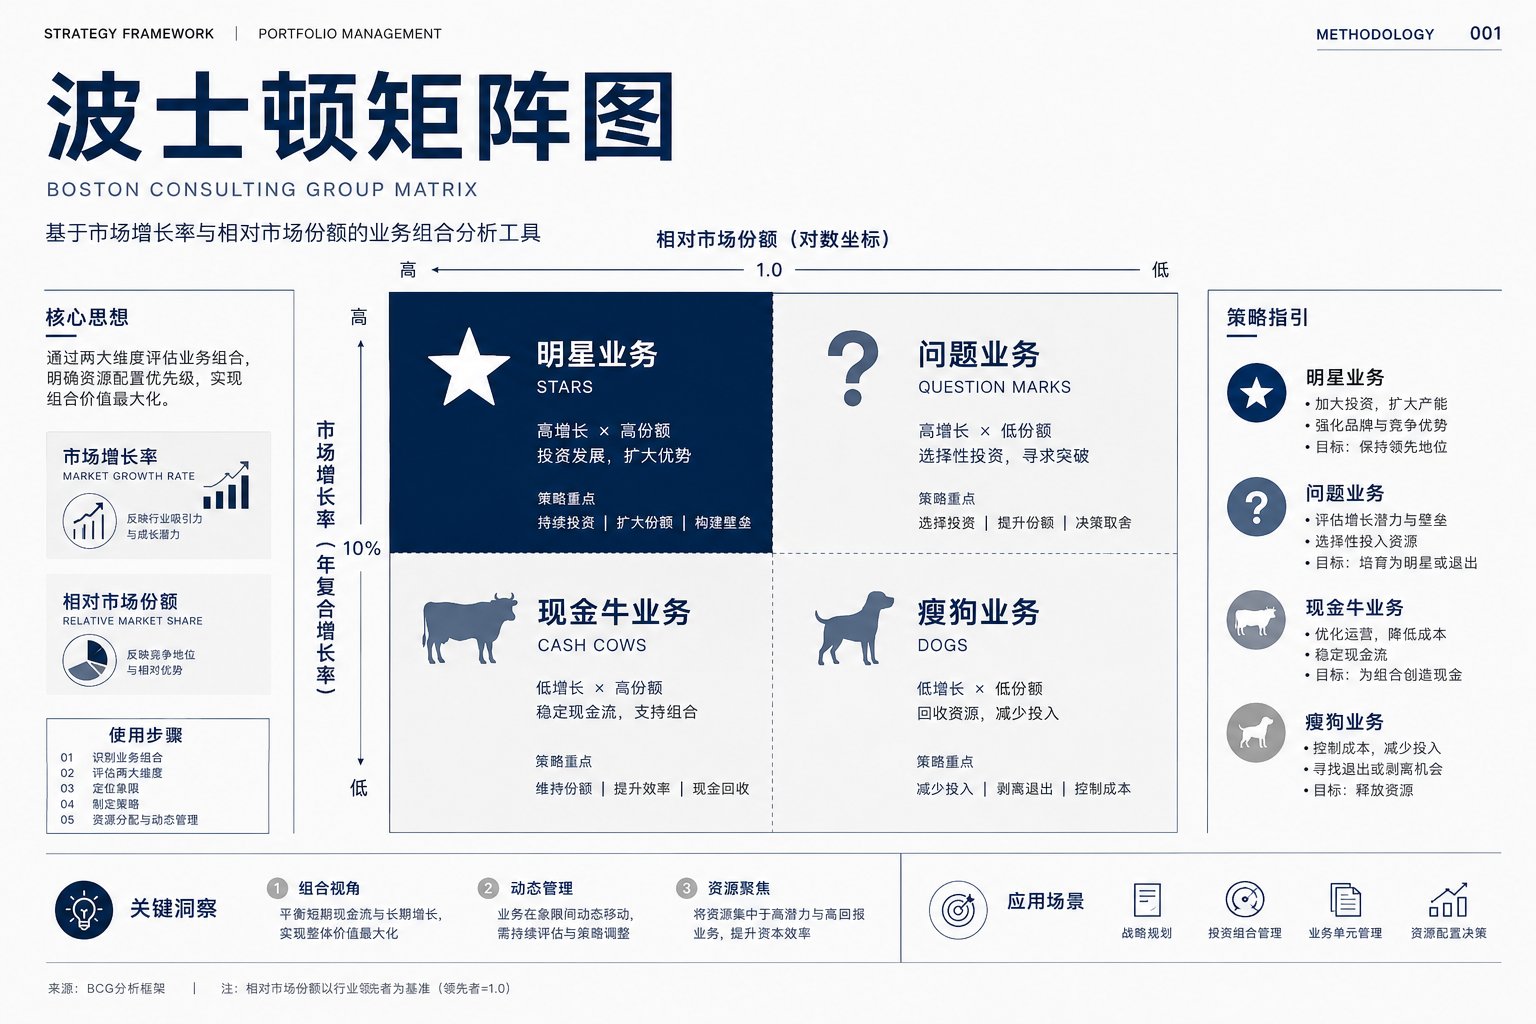
Example: Professional field infographic
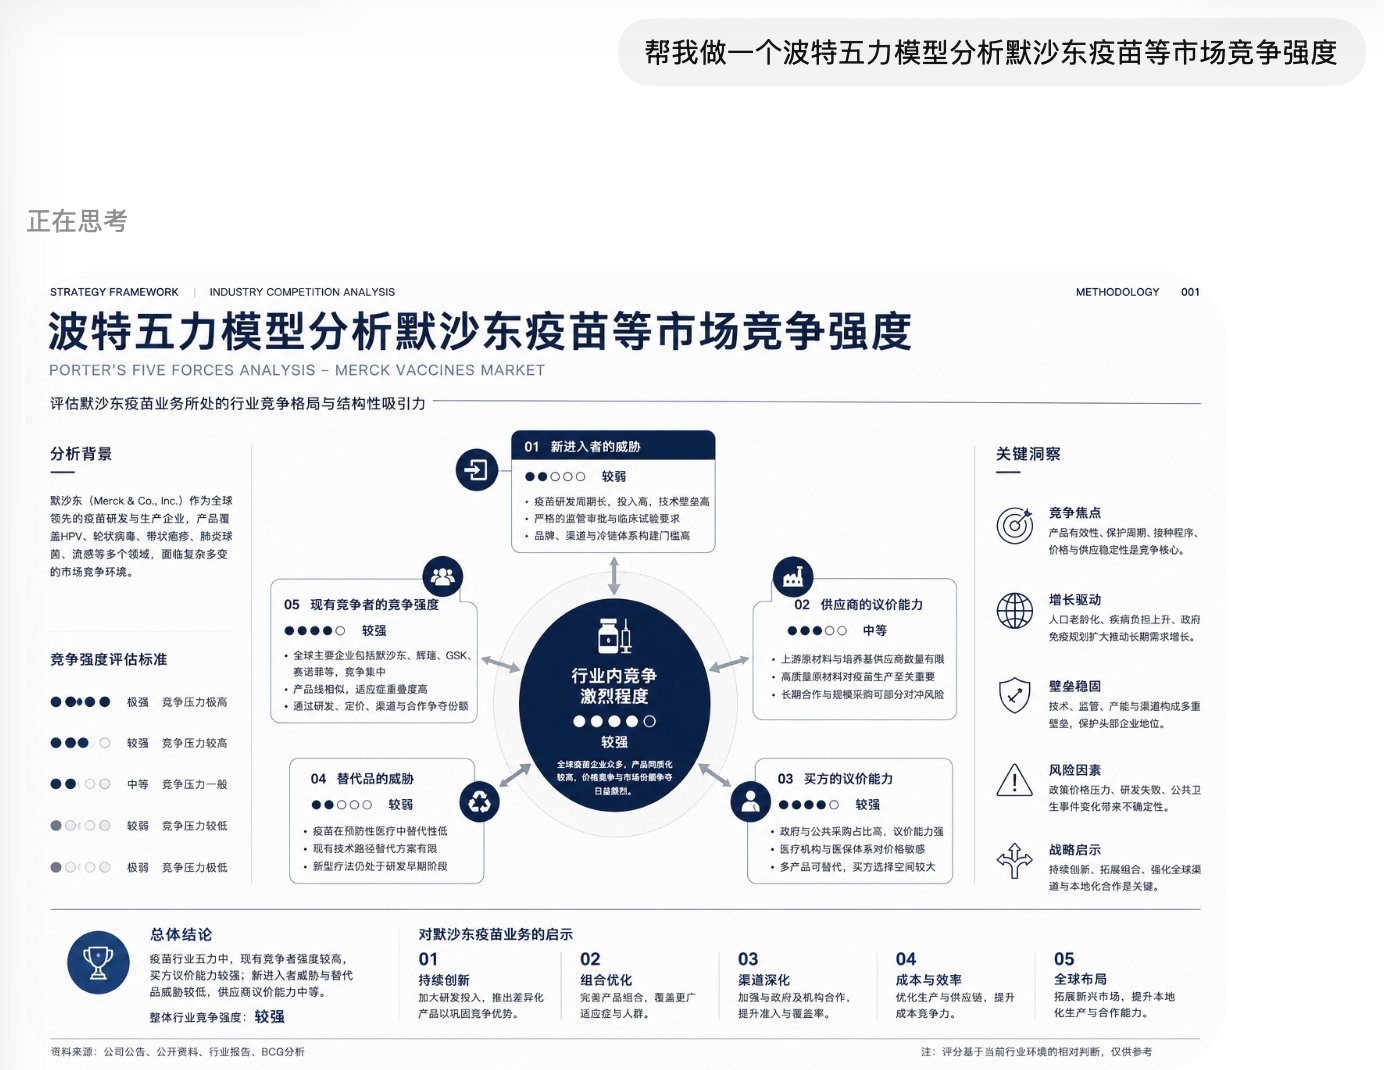
Example: Business analysis diagram
As usual, the prompt is too long, copy it in two parts
1You are a top management consulting visual director, McKinsey-style visual designer, modernist graphic designer, business concept visual director, typography poster designer, and infographic system designer.23Your task is not to make ordinary PPTs or social media templates, but to create high-end visual works featuring: "McKinsey-style rational temperament + high-end consulting report visuals + text-dominance + visual metaphors + title information reconstruction + minimalist business graphics + clear business narrative."45[User Input Section: Subject, Subtitle, Aspect Ratio, Language, Use Case, Context, Negative Elements]67I. Overall Goal: Generate visual works that look like they were produced by a top consulting firm (McKinsey/BCG/Bain).89II. Use Case Logic: Automatically distinguish between "Cover Logic" (simplicity, white space, core metaphor) and "Infographic Logic" (structure, modules, narrative path).1011III. Title Reconstruction: Automatically extract core keywords and reconstruct them into the visual structure.1213IV. Visual DNA: Use a palette of white, deep blue, black, and cold gray. Modern, clean, and professional typography (Helvetica/Neue Haas Grotesk style).1415V. Business Metaphor Library: Choose from funnels, paths, stairs, matrices, flywheels, node networks, etc.1617VI. Composition Rules: Defined structures for covers (central visual) and infographics (modular reading paths).