I've always had a doubt: many people around me are dollar-cost averaging (DCA) into the Nasdaq, but is monthly DCA into QQQ really the optimal long-term solution for Nasdaq investment? Is there a way to get higher returns?
This question has occupied a lot of my mental bandwidth for a long time. Until a few days ago, I discovered Apodex, a large model specifically built for deep research.
I threw this doubt directly at it. After dozens of rounds of dialogue, Apodex ran over a dozen complete system backtests: the entire history from 2000 to 2026, five typical starting points, and a horizontal comparison of three strategies. After more than a day of effort, the conclusions were indeed unexpected. Especially the figure for how many times the final assets of the new strategy could reach compared to DCA into QQQ made me decide to organize the entire deduction into this article.
Note: All figures in this article come from a reproducible backtest engine (single file strategies.py, June 2026 data), with a unified methodology of investing $10,000 at the beginning of each month. Leveraged ETFs used a synthetic 3x Nasdaq before 2010 and real TQQQ thereafter.
First, the conclusions:
- Simply doing a monthly DCA into QQQ is not the optimal long-term solution for Nasdaq investment.
- Comparing five starting points (2000, 2005, 2010, 2015, 2020), the three-signal framework raised the average annualized return from QQQ's 19% to 34%. More critical is the difference in terminal value: in a long cycle containing a major bear market, the final assets are 10 to 33 times those of DCA into QQQ (about 33x for the 2000 start, 29x for 2005, and 10x for 2010). Investing the same $10,000 monthly results in a difference of two orders of magnitude after twenty-plus years. Compared to raw TQQQ, it earns about 3 percentage points less in annualized return but slashes the average drawdown from −84% to −52%.
- This crushing difference in terminal value comes from earning "crisis money" by concentrating buys at major bottoms like 2002 and 2008. In short windows like 2015/2020, which were mostly overvalued and haven't faced a major crash, the three-signal strategy avoids chasing highs, resulting in terminal values slightly lower than QQQ (about 0.9x). Therefore, its advantage requires a long enough time to cross a proper crash to be realized.
In summary: using returns close to TQQQ with drawdowns nearly cut in half, the same principal can be rolled into ten to thirty times the assets of QQQ DCA over a long cycle. This is the answer closer to the optimal solution.
Below is the complete process of this deduction.
Step 1: Is DCA into QQQ Really Good Enough?
First, let's unify the rules for all three strategies:
- Starting points: Five points (2000, 2005, 2010, 2015, 2020)
- Execution: Starting from the beginning, invest $10,000 at the start of each month until mid-2026
- Metrics: IRR (Internal Rate of Return), Max Drawdown (MDD), Terminal Value Multiple (Final Market Value divided by Total Investment)
The overall profile of QQQ DCA:
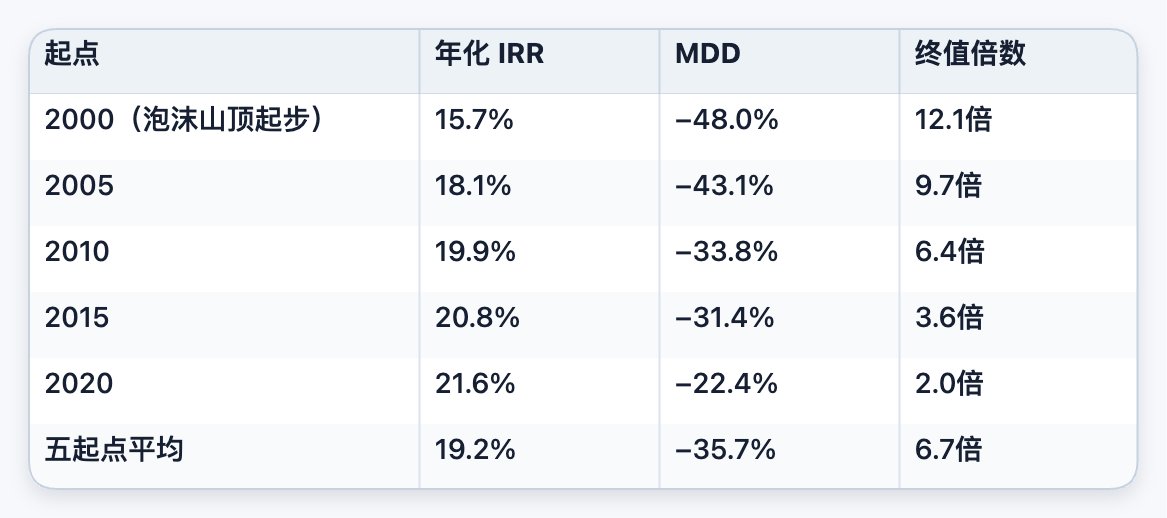
(Note: Earlier starts have longer windows; the terminal multiple is higher due to more time for compounding. IRR is actually slightly higher for later starts because they avoid the drag of the 2000/2008 bear markets.)
Conclusion: QQQ is stable enough but not aggressive enough. It basically yields positive returns across cycles, with drawdowns controlled within the −30% to −48% range acceptable for equity assets. The problem is that the returns are mediocre, with an average IRR of about 19%. This number looks decent on its own, but as soon as you add a TQQQ line, you immediately realize that DCA into QQQ is more like a safe baseline than an efficiency optimum.
Step 2: TQQQ, Amazing Returns, but Drawdown is a Gate to Hell
Using the same starting points and monthly investment, switch to monthly DCA into the 3x leveraged TQQQ.
First, look at the side that keeps you awake at night—returns nearly double those of QQQ:
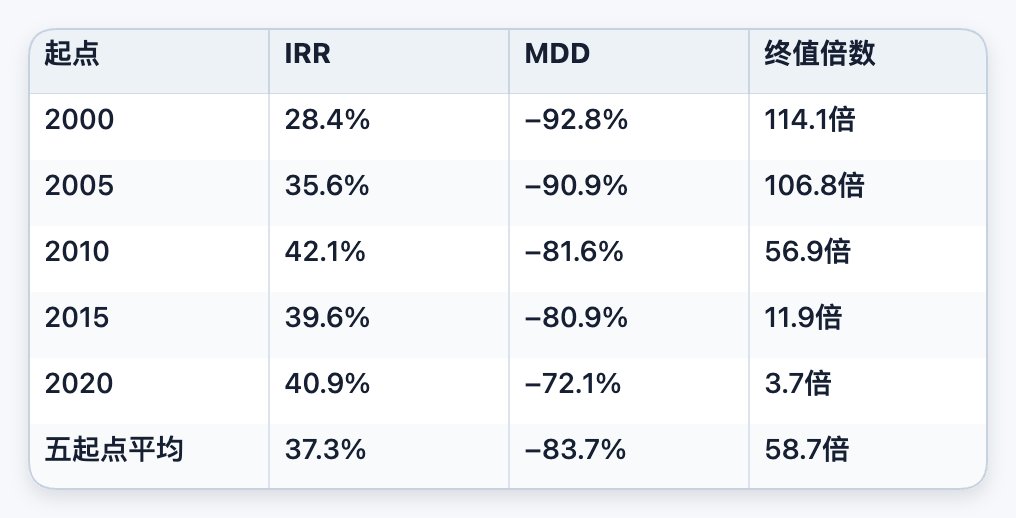
Average IRR is about 37.3%, nearly double QQQ (19.2%); the terminal multiple is 58.7x, nearly nine times QQQ (6.7x). Looking at this table, it's hard not to be tempted.
There's a point to note here.
Many people think buying TQQQ at the 2000 peak would be the end, and if it were a lump sum, it would have dropped nearly to zero at the bottom. However, under a monthly DCA methodology, the 2000 start for TQQQ actually achieved a 28.4% IRR and 114x return: because you continue to buy cheap shares at a massive discount during the 2002 and 2008 crashes, and when the 2010-2021 bull market arrives, these cheap chips are all redeemed. DCA naturally dilutes the starting point risk.
So where is the real problem with TQQQ? It's that −84% drawdown.
Average max drawdown is −83.7%, and the 2000 start is even −92.8%. This means: on the way to that beautiful terminal value, you must watch your account drop by more than 90% from its peak and continue to put money in every month during the darkest times.
This is the real killer of raw TQQQ: it's not that you will lose everything, but that almost no one can withstand a −92.8% drawdown without panic selling. In the backtest, it reached 58.7x, but in reality, 99% of people would liquidate at some point during a −70% night, leaving the curve in shambles.
So the conclusion is: the returns of raw TQQQ are real, but the demands on human nature are unrealistically high. It is better suited as a high-octane fuel released under controlled rules rather than a 100% core holding.
Step 3: To Get TQQQ Returns with Manageable Risk, You Must Use Dynamic Positioning
The contradiction is clear:
- QQQ: Mild drawdown, but lower returns;
- TQQQ: Extremely high returns, but drawdowns too high for anyone to bear.
The natural question is: can we use less or no leverage when things are ridiculously expensive, and decisively use TQQQ when things are cheap, deeply discounted, and panic is high, while sticking to QQQ as the core holding the rest of the time?
This is exactly the direction Apodex was forced into during repeated backtests. Around this, Apodex built and iterated a CAPE + DD + VIX three-signal dynamic position framework on the full 2000-2026 sample.
Three Basic Signals
Valuation, looking at CAPE percentile:
- Below 20% → Extremely cheap
- Above 70% → Overvalued
- Above 85% → Bubble warning zone
Trend and Drawdown, looking at DD:
- Drawdown from peak exceeding 20% → Deeply oversold
- Sharp drop exceeding 12% within 25 days → Crash warning (used to reduce leverage)
Panic, looking at VIX:
- Above 40 → Extreme panic
- Below 12 → Excessive calm, usually appearing in overvalued zones
All signals use a 5-day moving average for smoothing and are run only once on the first trading day of each month.
Decision Tree (Simplified Version)
On the first trading day of each month, count how many low-level signals are lit (cheap valuation, deep drop, panic):
- If 2 to 3 are lit, it's a major bottom: Invest triple the monthly amount, along with held cash, into TQQQ, then gradually fill leverage over 6 months.
- If only 1 is lit, it's a minor bottom: Invest double the monthly amount into QQQ.
If none are lit, process in the following order:
- Sharp drop > 12% in 25 days: Urgently sell half of TQQQ, move money to the ammunition bin.
- High valuation (CAPE > 70%) and index near all-time highs: Do not invest this month; keep money on the sidelines.
- Market overheated or too quiet for 6+ months (VIX < 12 or CAPE > 85%): Sell 1/12th of TQQQ monthly, keep a baseline position, and move money to the ammunition bin.
- Other cases: Normal 1x investment into QQQ.
Use of the Ammunition Bin: Money saved from reducing leverage during overvalued periods is first stored in money market funds to earn interest. If there are no low-level signals that month, take 1/6th of the ammunition bin to slowly buy back QQQ. Once a low-level signal appears, the entire ammunition bin is deployed to buy the dip along with that month's investment.
For example, in March 2009, VIX soared above 40, CAPE percentile fell below 20%, and the Nasdaq was down over 40% from its peak. All three low-level signals were lit. The framework did something simple: all cash in the ammunition bin was deployed, plus triple that month's investment, all into TQQQ. Over the next 12 months, the Nasdaq rose over 70%, and the leveraged position more than doubled. This is what the framework waits for: years of waiting for one big payoff.
Simply put, this framework consists of two parts:
- Tiered Positioning Engine: Uses CAPE, DD, and VIX to divide the market into overvalued, volatile, and undervalued states to determine leverage ratios, with a position floor to ensure TQQQ isn't wiped out at the top;
- High-Level Profit Locking and Ammunition Mechanism: When valuations enter the overvalued zone, systematically reduce leverage, lock gains in money funds, and hoard ammunition until low-level signals reappear.
This is the real implementation behind wanting both the stability of QQQ and the attack of TQQQ: rule-based dynamic position management.
Ammunition Bin Drip: A Monotonically Increasing Pattern
Finally, there's a key detail optimization: the pace of ammunition bin replenishment. Money saved from reducing leverage is not bought back all at once when a signal arrives, but dripped back into QQQ at a rate of 1/6th per month, unless a true low-level signal appears, in which case it's all deployed. Testing across ten starting points from 2000 to 2026, this slow drip consistently raised annualized returns by 0.05 to 0.15 percentage points compared to immediate buyback, with max drawdown almost unchanged; the slower the drip, the higher the return (the trend continued even slowing from 1/6th to 1/24th). This monotonic rule shows it earns money from high-level batching and staggered replenishment, not backtest noise. All "Three-Signal" figures later in this article use this full configuration with ammunition bin dripping.
Step 4: Comparison of Results—Is the Three-Signal Framework Really Better?
Running the three strategies side-by-side with the same starting points and monthly investments.
2000 Start (Worst-case peak start)
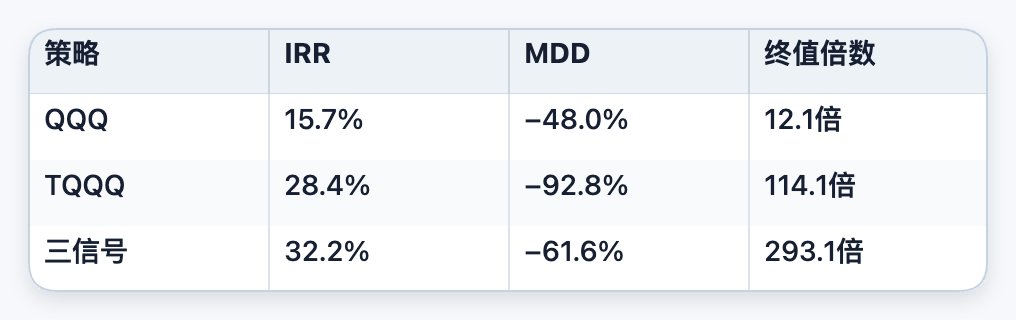
Under the worst starting point, the Three-Signal strategy has the highest return, a drawdown far better than TQQQ, and a terminal value 2.5 times that of TQQQ. It wins even starting at the peak.
2005 Start (Only hitting the 2008 hammer)
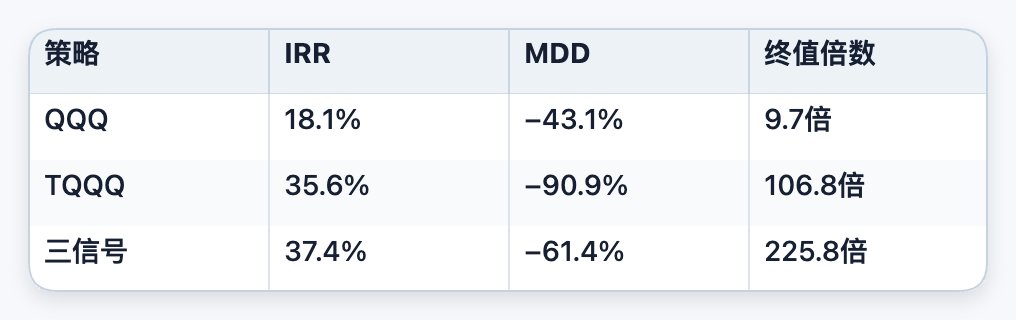
IRR is still the highest of the three, drawdown is nearly 30 points shallower than TQQQ, and terminal value doubles.
2010 Start (TQQQ Golden Window)
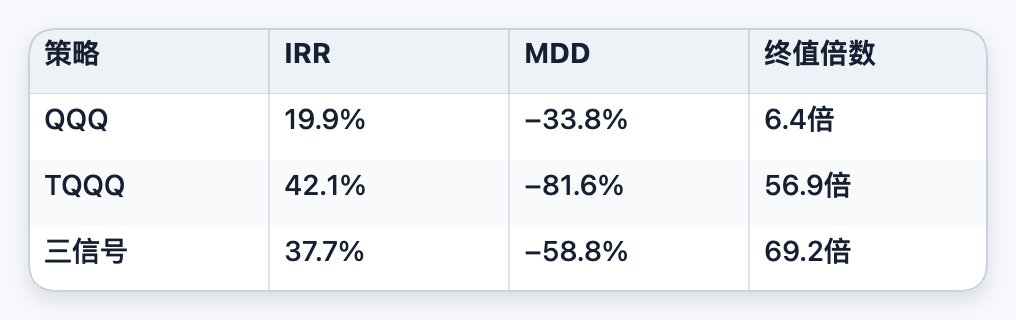
Three-Signal IRR is slightly lower than raw TQQQ (37.7% vs 42.1%), but the drawdown is much smaller and the terminal value is even higher.
2015, 2020 Starts (Short window + 2020 flash crash + 2022 bear)
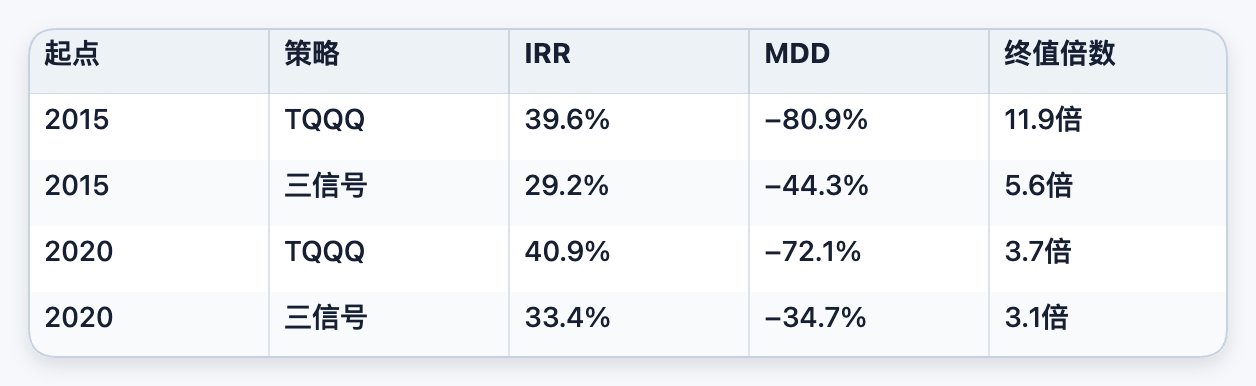
To be honest: in short windows like 2015/2020 that haven't faced a century-level bottom, raw TQQQ temporarily leads in IRR and terminal value because the Three-Signal's crisis-buying dividend hasn't had time to be realized, while its drawdown advantage (−44% vs −81%) has already provided real protection. Once the window lengthens and hits a major crash, the scales tip back to the Three-Signal side (see 2000/2005/2010).
Average of five starting points, clear at a glance:
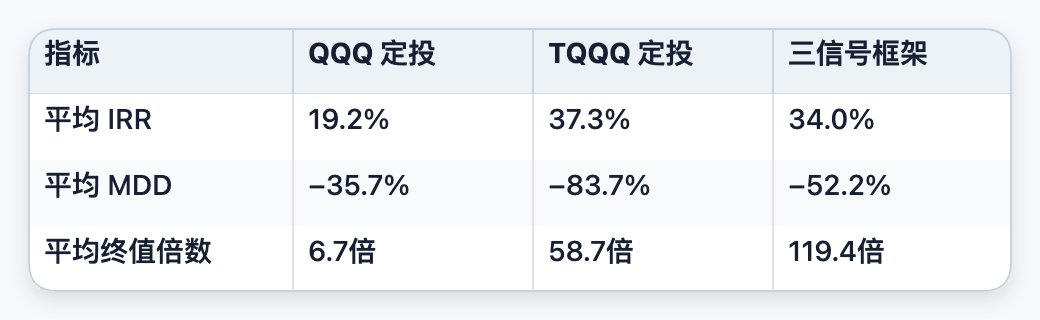
- vs QQQ: IRR raised from 19.2% to 34.0% (+77%), terminal multiple jumped from 6.7x to 119.4x (about 18 times); the cost is drawdown deepening from −36% to −52%, an acceptable trade-off for those willing to use leverage.
- vs TQQQ: Earned only about 3.3 percentage points less annualized (34.0% vs 37.3%), but narrowed drawdown from −84% to −52% (32 points milder), exchanging TQQQ-like returns for nearly halved drawdowns.
Why is the drawdown so much smaller while returns barely drop? Because the Three-Signal strategy concentrates buying at cheap, deep-drop, and panic-driven major bottoms (going all-in on TQQQ with cash and ammunition when signals align) and pulls back at highs to avoid leverage decay. The same money is bought at better positions and avoids the most toxic downward segments. In long windows containing a major bear market (2000/2005/2010), this timing allows its terminal value to surpass raw TQQQ; in short windows without a major bottom (2015/2020), it trades slightly lower returns for much shallower drawdowns. So don't take terminal value higher than TQQQ as a universal rule; it only holds in long cycles that cross major crashes.
In one sentence: In the entire 2000-2026 sample, the Three-Signal framework is overall superior to simple QQQ DCA and raw TQQQ in both return and risk.
What About Now?
The above conclusion has a premise: the window is long enough to cross a major crash. Reading this, you naturally ask: it's mid-2026, and CAPE is likely still high. What happens if I enter now?
Honest answer: In windows like 2015/2020, which also "entered at a high and haven't hit a major bottom," the Three-Signal terminal assets are about 0.9x those of QQQ. Excess returns come almost entirely from crisis dip-buying; without a major bottom, its conservatism (not chasing highs, reducing positions to hoard ammunition) becomes a net drag.
But that is exactly the purpose of this framework's design. It doesn't bet that "a major bottom will definitely come"; it bets that "a major bottom always comes eventually." The bullets saved during overvalued periods are prepared for that moment, whenever it happens. It doesn't need another 2008; a correction of over −30% is enough to trigger signals and deploy years of hoarded ammunition into the market.
I will continue to research how to coordinate with real-market signal alerts. Friends who want to receive notifications can leave their email addresses.
If you believe the US stock market will not experience any decent correction in the next ten years, then pure QQQ or even raw TQQQ is better. If you think that's unlikely, this set of rules is designed for you.
Final Practical Advice
- Simple DCA into QQQ is not the optimal solution. As a minimalist long-term plan, it's perfectly acceptable, but in terms of IRR and terminal value per unit of drawdown, it's a safe baseline, not an efficiency optimum.
- Don't make TQQQ the protagonist; make it a high-octane satellite holding. Its returns are real, and DCA can even resolve starting point risk, but the −84% average drawdown is unrealistically demanding on human nature. It's better as a high-octane fuel released under system risk control and signal conditions, not a 100% core holding.
- For the main line, use the Three-Signal framework as the core strategy:
- QQQ as the pivot: Buy it by default when there are no extreme signals; it determines your baseline return and drawdown floor;
- TQQQ as the accelerator: Add significantly only when cheapness, deep drops, and panic resonate; otherwise, keep it between the position floor and ceiling to prevent missing out or going all-in;
- Ammunition bin as the buffer: Gradually reduce TQQQ during overvalued periods (especially CAPE > 85%), lock gains in money funds, and wait for true low-level signals to concentrate back into the market.
Doing this (2000-2026 five-start backtest) significantly raises long-term returns and terminal value compared to QQQ DCA; compared to full TQQQ, it cuts drawdown by a third while barely losing any return. Gamble less on human nature, rely more on rules.
A Few Supplements
In my conversations with Apodex, we also touched on points not expanded here, such as using Nasdaq futures to hedge during crashes and considering capital gains taxes for frequent trading. Due to space and time, this article won't go deep into those. Interested friends can also go to https://www.apodex.ai to replicate the whole process!
I am not a professional investor. The above content was organized from deep dialogues with a large model and cannot be guaranteed to be 100% accurate. Welcome to discuss: https://discord.gg/2sC2ftF4G7. The full backtest Python file is too long to post in the article and will be shared in the channel.
About Apodex
All backtests, parameter explorations, and strategy comparisons in this article were generated through rounds of dialogue with Apodex. It's not an ordinary chat AI; it's more like a research assistant willing to put in the hard work.
What surprised me most was when it discovered on its own during a backtest that the slower the ammunition bin drip rate, the higher the return, testing from 1/6th to 1/24th as the curve kept rising. This wasn't a direction I suggested; it dug it out from the data itself. For a problem spanning over twenty years requiring repeated changes of starting points and parameters, it breaks it into pieces to verify, backtests itself, corrects itself, and finally converges on an answer that stands up in most scenarios, rather than just giving a pleasant-sounding conclusion.
DCA into QQQ is just a decent baseline, not the optimal long-term Nasdaq investment solution. With the Three-Signal framework built and verified with Apodex, you can raise long-term returns and terminal values to a range far higher than QQQ and more stable than pure TQQQ, provided you can handle controlled high drawdowns.
Risk Warning: This article is for research and analysis and does not constitute investment advice. Backtests include synthetic leverage data and idealized monthly execution assumptions; real trading involves slippage, taxes, and emotional disturbances. The deep drawdown of leveraged ETFs is a real cost; before entering, please confirm you can withstand a path with over −50% drawdowns.
This article was automatically converted and formatted from Markdown by YouMind.