Claude Shannon's strange portfolio, the mathematics of volatility harvesting, and why return belongs to a system, not an asset
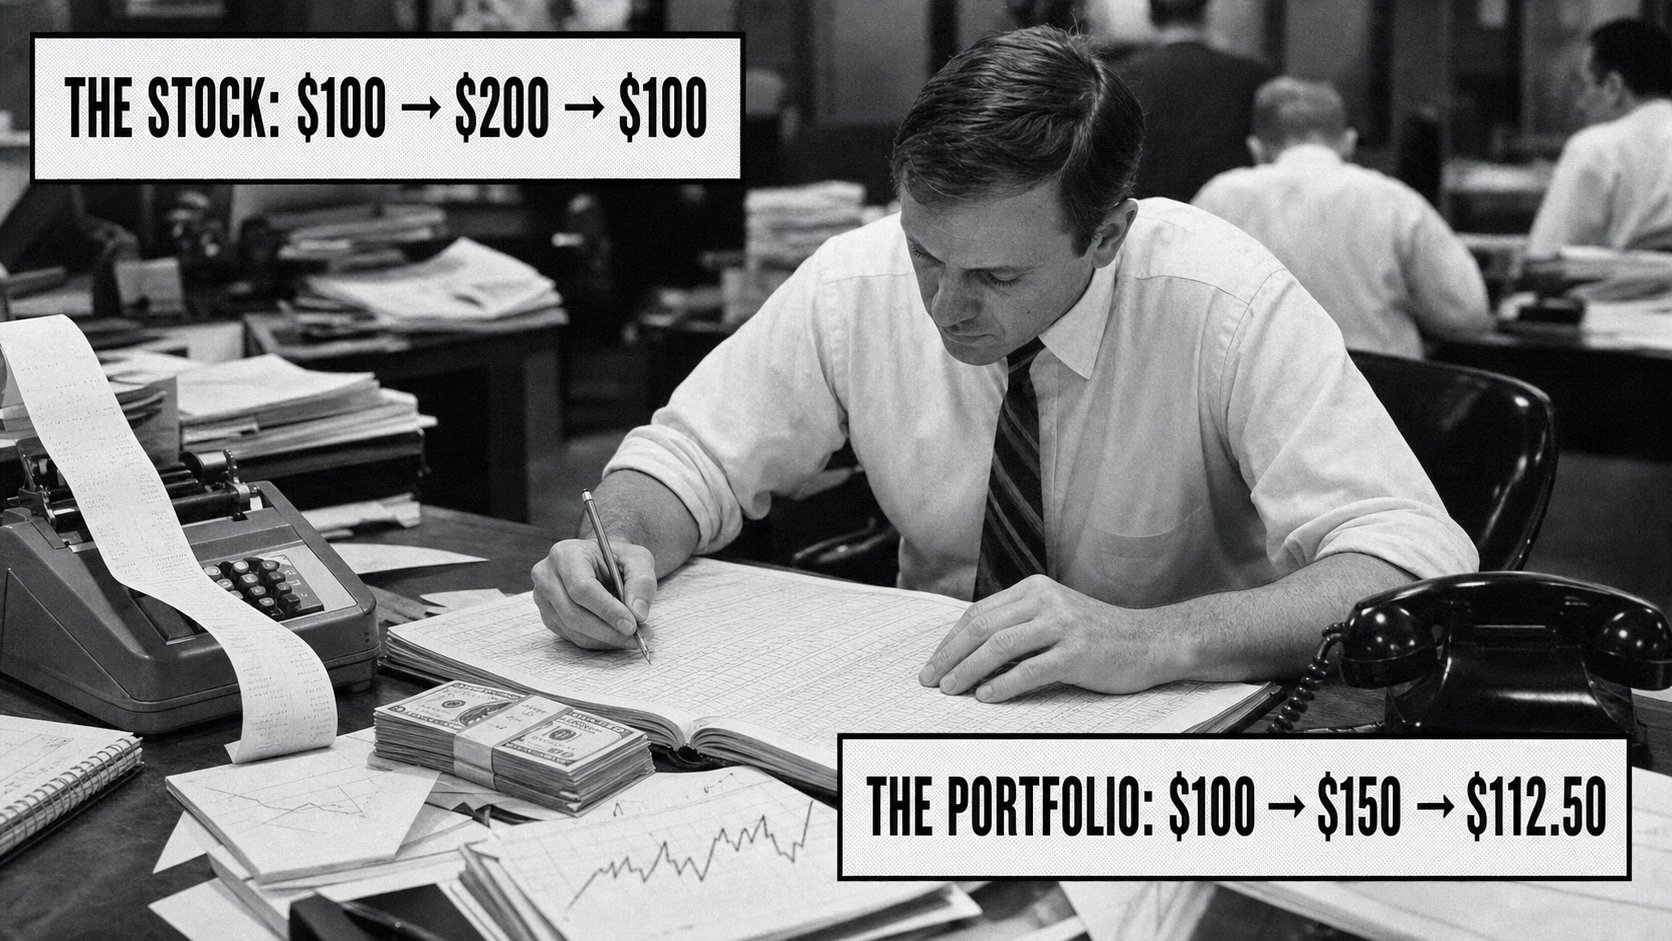
A stock starts at $100. It doubles to $200. Then it falls back to $100. Buy and hold earns exactly $0. But a mechanical portfolio that keeps half its money in the stock and half in cash ends with $112.50. Same stock. Same path. No prediction. No leverage. The only difference is one rebalance in the middle. That result sounds like a trick because most people think return is a property of an asset. It is not. Compound return belongs to a complete system:
- the asset;
- the position size;
- the path prices take;
- and the rule that moves capital along that path.
Change the rule and the same market can produce a different ending. This thought experiment is associated with Claude Shannon, the MIT professor and Bell Labs mathematician who created information theory. The idea is now often called Shannon's Demon: a portfolio can sometimes turn volatility itself into compound growth by repeatedly selling part of what rose and buying part of what fell. The arithmetic is simple. The conditions that make it work are not.
01. The $12.50 that appeared from nowhere
Start with $100:
- $50 in the stock;
- $50 in cash.
The stock doubles. Your stock position becomes $100, while the cash remains $50. The portfolio is now worth $150. Rebalance back to 50/50:
- sell $25 of stock;
- hold $75 in stock;
- hold $75 in cash.
The stock then falls by half, returning to its original price. Your $75 stock position becomes $37.50. The cash remains $75. Final portfolio value:
$37.50 + $75 = $112.50
The stock completed a perfect round trip. The portfolio made 12.5%. Nothing was predicted. The system did not know whether the stock would rise first or fall first. If the same two moves happen in reverse order, the result is still $112.50. The profit came from changing exposure after the first move. When the stock became more expensive, the system sold some. When it became cheaper, the system owned enough cash to buy more. "Buy low, sell high" stopped being advice and became an allocation rule.
02. The equation hiding inside the trick
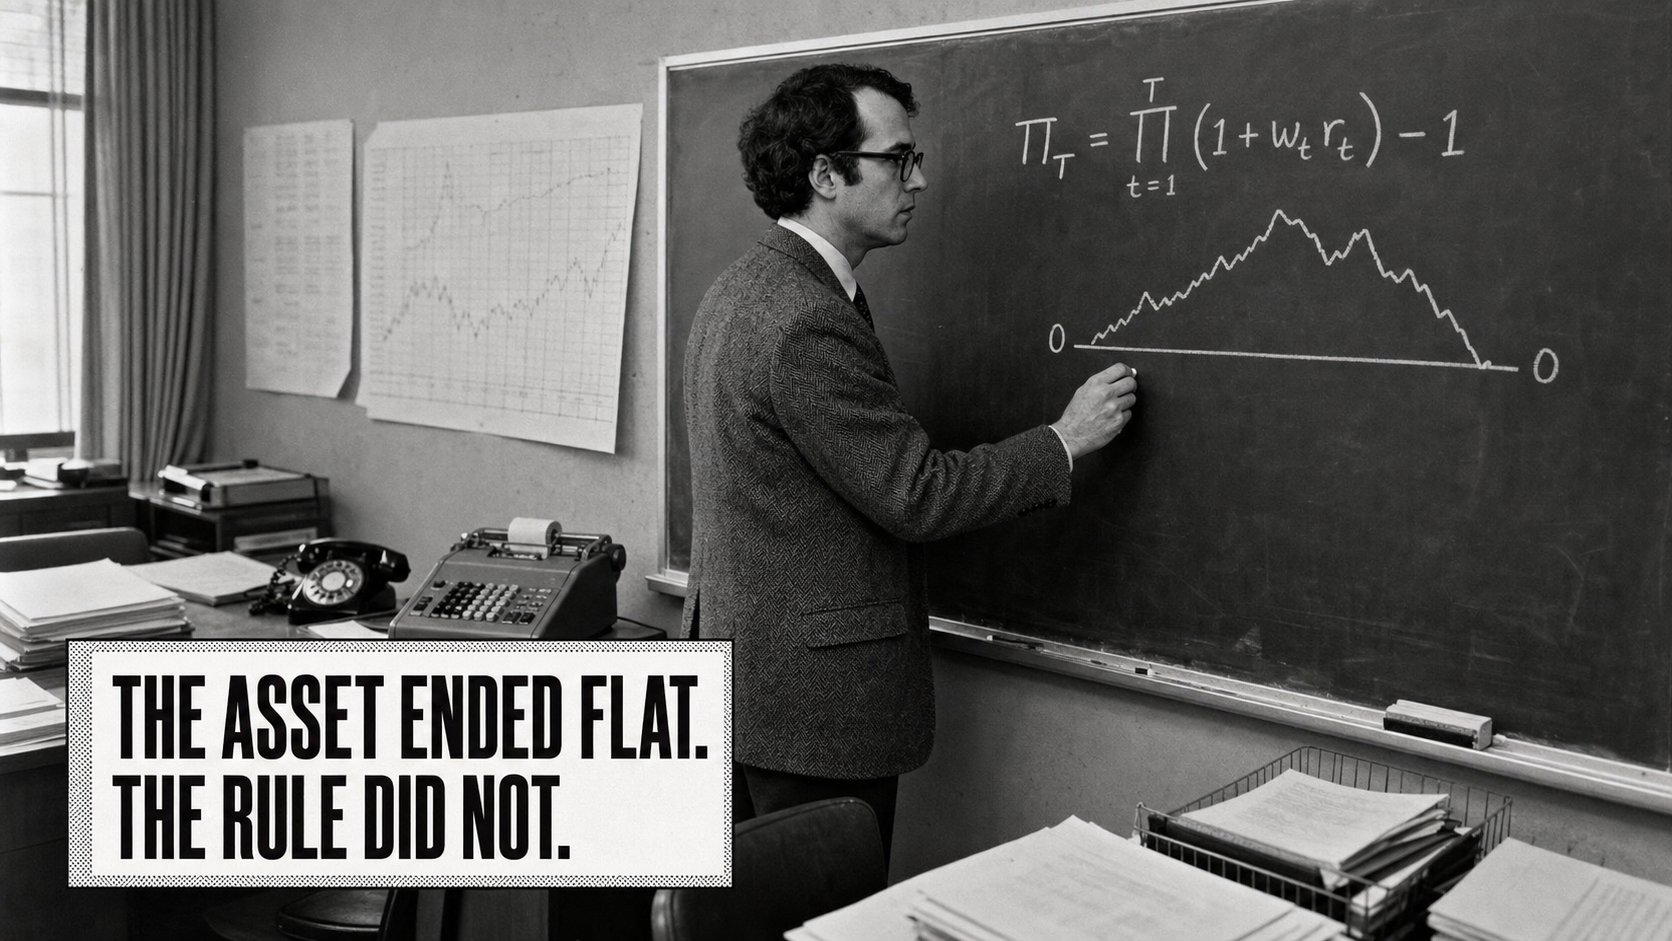
Let the stock rise by a factor of u, then fall by the reciprocal factor 1/u, so it finishes exactly where it began. A buy-and-hold investor ends with the same amount:
u × (1/u) = 1
A 50/50 stock-and-cash portfolio, rebalanced after the first move, grows by:
[(1 + u) / 2] × [(1 + 1/u) / 2]
Which simplifies to:
(2 + u + 1/u) / 4
For every positive u, the arithmetic mean-geometric mean inequality tells us:
u + 1/u ≥ 2
So the rebalanced portfolio finishes with at least what it started with, and with more whenever the stock actually moves. If u = 2:
(2 + 2 + 0.5) / 4 = 1.125
That is the 12.5% gain. The equation is not forecasting the asset. It is exploiting the distance traveled. That gap between a simple formula and a tradable system explains one of Wall Street's stranger salary numbers. Jane Street currently lists a $300,000 base salary for quantitative traders and quantitative researchers in New York, with an annual discretionary bonus on top. The equations are not what make those people expensive. Every equation in this article is public.
The expensive skill is deciding whether the movement is repeatable, whether correlation will survive stress, how much capital the effect deserves, and whether costs erase it before it reaches the portfolio. At institutional scale, a few basis points applied across billions of dollars can be worth millions. The math is free. Knowing when it deserves real capital is not. That distinction is the whole article. Most investors ask:
Where will the price finish?
The rebalance asks:
How much useful movement occurred before it finished there?
03. Volatility is usually a tax. Here it becomes raw material
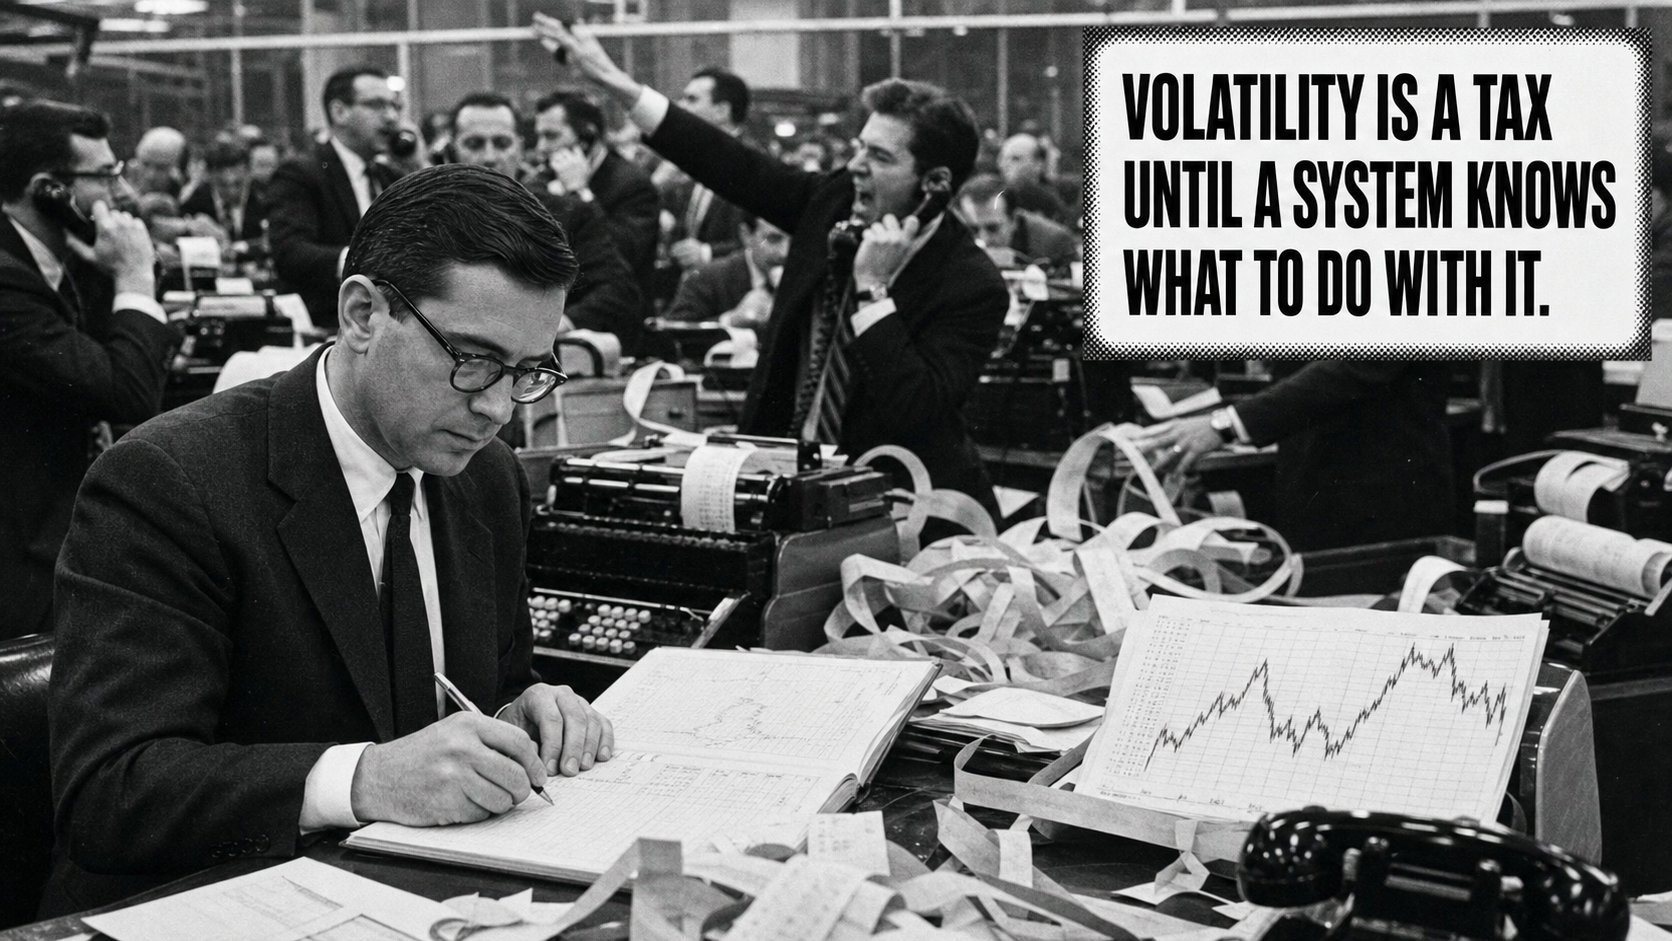
Compounding punishes volatility. A 50% gain followed by a 50% loss does not bring you back to even:
1.50 × 0.50 = 0.75
You are down 25%. This is why arithmetic averages can be dangerous. The average of +50% and -50% is zero, but the account did not experience zero. Capital compounds through multiplication, not addition. For moderate returns, long-run geometric growth can be approximated as:
compound growth ≈ average return - variance / 2
More variance creates more drag. Shannon's Demon does not abolish that law. It changes where the variance lives. Instead of leaving all the capital inside one volatile path, the portfolio repeatedly splits capital across components and restores the target weights. The rebalancing can reduce portfolio variance faster than it reduces the arithmetic return. That difference can appear as extra compound growth. In a two-asset model with similar volatility, one useful approximation for the rebalancing growth differential is:
rebalancing effect ≈ (σ² / 4) × (1 - ρ)
Where:
- σ is volatility;
- ρ is correlation between the assets.
The implication is immediate. More volatility can create more material for rebalancing. Lower correlation gives the system more independent movement to work with. If correlation rises to one, the effect disappears. Two assets moving together are not two engines. They are one position wearing two labels.
04. Why diversification needs motion, not a longer ticker list
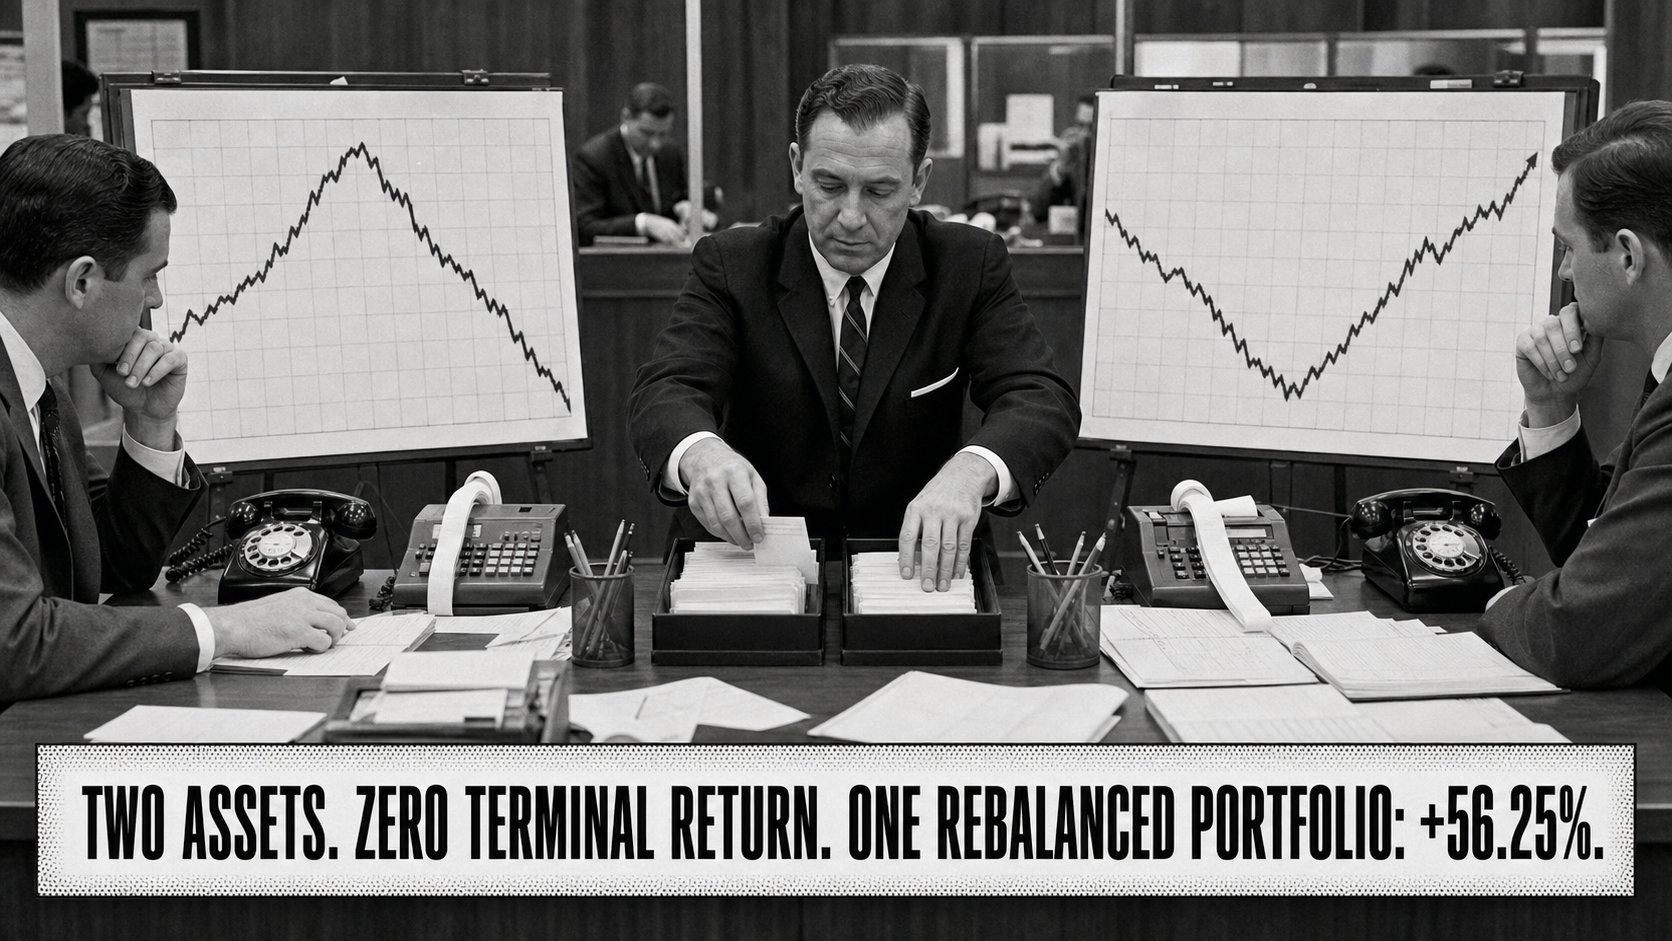
- Start with $50 in A and $50 in B.
- After the first move, A is worth $100 and B is worth $25.
- Rebalance the $125 portfolio to $62.50 in each asset.
- A then halves to $31.25, while B doubles to $125.
- Final value: $156.25.
Two assets that each produced zero terminal return created a 56.25% portfolio gain under the rebalancing rule. That is the extreme version, built to expose the mechanism. Real assets do not alternate perfectly. Their returns are not free, smooth, independent, or guaranteed to mean-revert on your schedule. But the lesson survives: Diversification is not merely owning several assets. It is owning several return paths and having a rule for moving capital between them. A static portfolio lets winners become larger and losers become smaller.
A rebalanced portfolio repeatedly sells concentration and buys balance. The first is a bet that the trend should keep receiving more capital. The second is a bet that the original allocation remains worth defending. Neither is automatically correct. They are different views of the world.
05. The real market does not give you the clean example for free
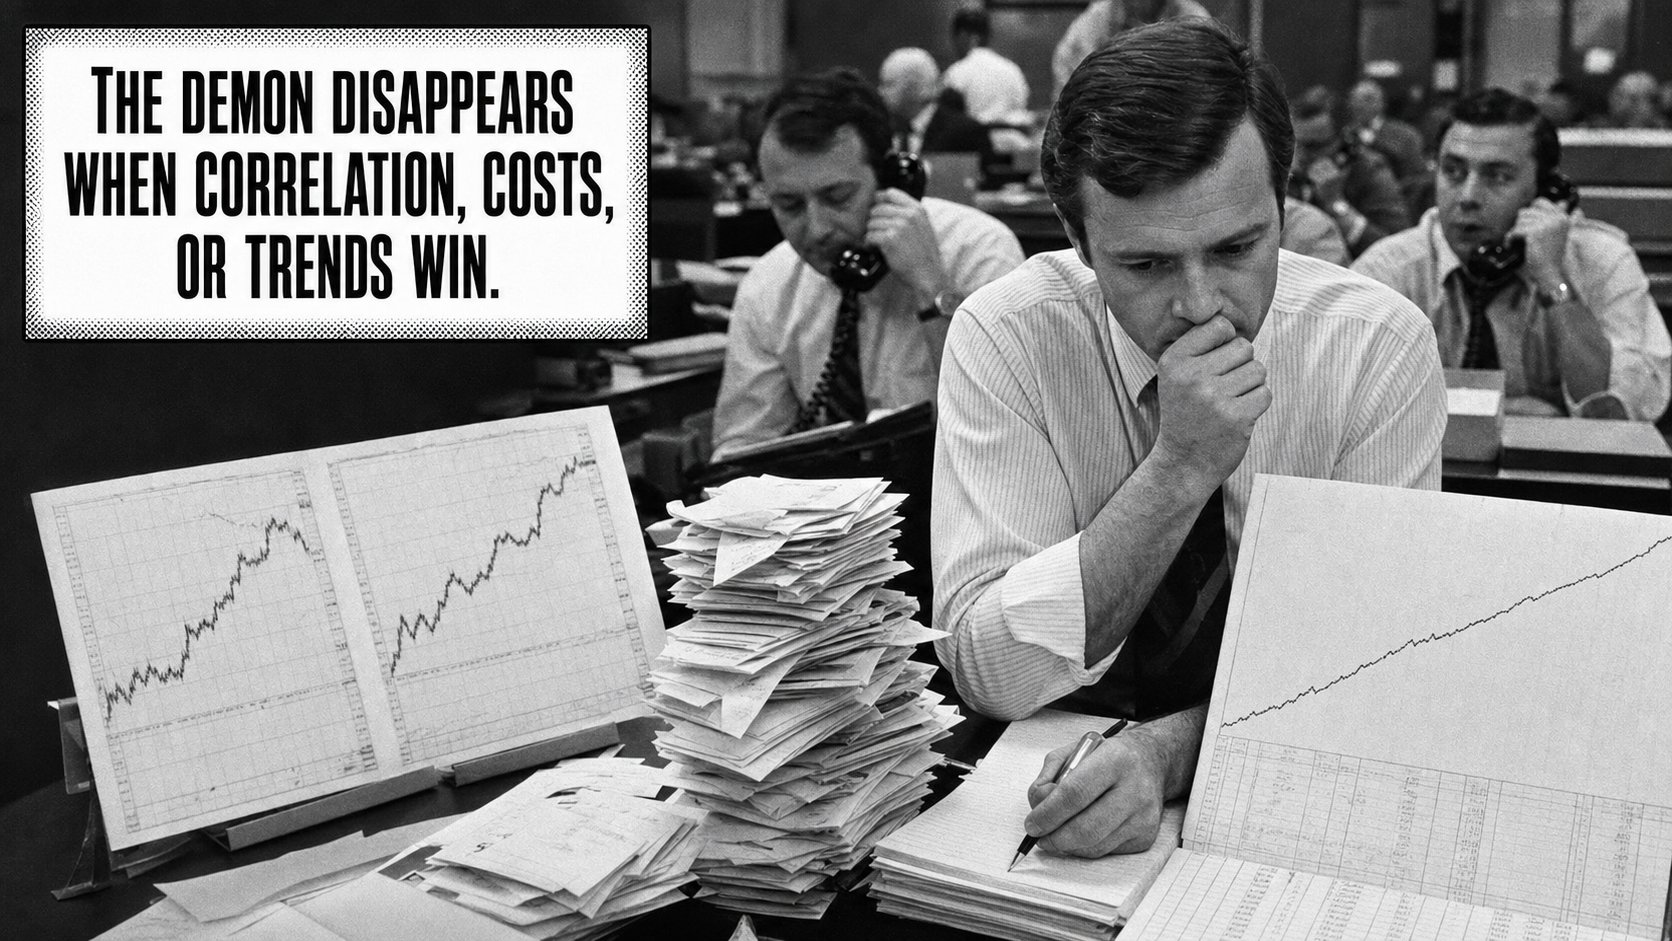
This is where the viral version of Shannon's Demon usually stops. The investable version begins. Rebalancing is not an arbitrage. It is a strategy that depends on market behavior continuing to provide enough useful relative movement. It can fail for several reasons.
A strong trend can punish the seller
If one asset keeps rising for years, constant rebalancing repeatedly trims the winner. Buy and hold may dominate because concentration in the winning asset keeps increasing. The rebalance looks disciplined. The opportunity cost can still be enormous.
Correlations can rise when you need diversification most
Assets that behaved independently in calm markets can fall together during a liquidity shock. The portfolio expected several engines and discovers it owns one crowded trade. The labels stay different. The failure mode becomes the same.
Costs attack every rebalance
Spreads, commissions, market impact, taxes, and slippage all charge rent on the mechanism. Rebalance too rarely and weights drift far from the design. Rebalance too often and turnover can consume the premium before it compounds.
The target itself can become wrong
Restoring a 50/50 allocation makes sense only if 50/50 still represents the risk you intend to own. If volatility, liquidity, expected return, or correlation changes structurally, mechanically returning to the old weights can turn discipline into denial. The hardest question is not:
When should I rebalance?
It is:
What evidence would prove that the allocation I am restoring is no longer valid?
06. What the data says when the toy example meets real portfolios
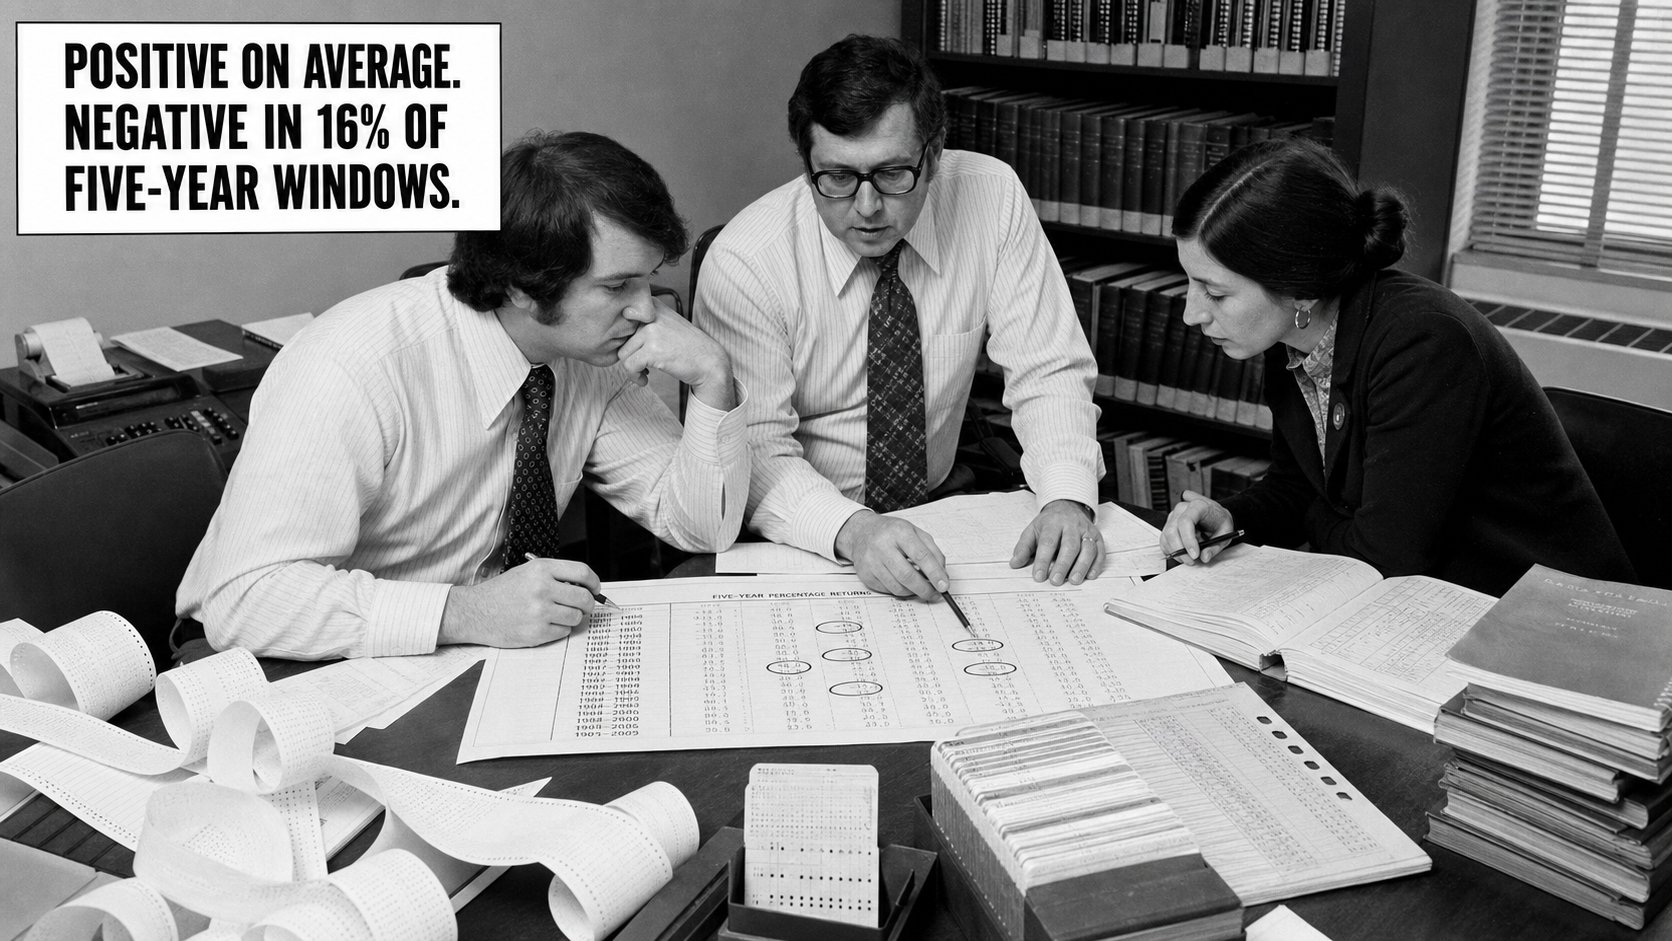
Researchers at EDHEC examined monthly rebalancing across portfolios drawn from 132 stocks that remained in the S&P 500 from November 1985 through December 2015. For randomly selected 30-stock portfolios over five-year horizons, the average historical growth-rate advantage of rebalancing over buy and hold was about 0.85 percentage points per year before transaction costs. That is economically meaningful. It is also not a guarantee. Across 302 historical five-year scenarios:
- 36% produced a rebalancing premium above 1 percentage point;
- 61% produced a premium above 0.5 percentage points;
- 16% produced a negative premium.
The same study explicitly notes survivorship bias in the stock universe, and its headline results exclude transaction costs. That is the honest version of the evidence. The effect can exist. The effect can be substantial. The effect can also be negative for years. Volatility is not free return. It becomes potentially useful only when paired with diversification, a durable allocation, disciplined execution, enough time, and costs low enough to leave something behind.
07. How to turn the idea into a portfolio rule

The practical system is less exciting than the paradox. That is why it has a chance of working.
- Define the job of every asset
Do not start with tickers. Start with risks:
- growth;
- inflation;
- recession;
- liquidity;
- duration;
- currency;
- crisis protection.
Two funds with different names can still own the same economic exposure.
- Choose target weights before prices move
The allocation should reflect the amount of risk you are willing to carry, not the asset that performed best last month. Write the targets down. A rule invented after a large move is usually an emotion wearing a formula.
- Use tolerance bands
Instead of trading on every calendar date, rebalance when an allocation moves far enough from its target to matter. For example, a 50% target might trigger action outside a 45% to 55% band. The exact band should reflect volatility, taxes, trading costs, liquidity, and how much risk drift you can tolerate.
- Use new cash first
Deposits, dividends, and interest can refill underweight positions without selling winners and creating unnecessary tax or turnover. The cleanest rebalance is often the trade you did not need to make.
- Measure the system against the right alternative
Do not compare a rebalanced diversified portfolio only with its own starting value. Compare it with:
- the corresponding buy-and-hold portfolio;
- the best single asset;
- the same portfolio after realistic costs;
- and the risk taken along the path.
Extra return is not a premium if it required hidden leverage or unacceptable drawdown.
- Define the condition that invalidates the allocation
Rebalancing assumes the components remain worth owning. Create a review rule for:
- structural changes in correlation;
- liquidity deterioration;
- broken investment theses;
- changing liabilities;
- tax consequences;
- and new concentration risks.
The rebalance should be mechanical. The decision to preserve the strategy should not be blind.
The part that actually matters
Claude Shannon is remembered for showing how information can survive noise. His portfolio thought experiment asks a related question: Can capital extract something useful from noise without predicting the next message? Sometimes, yes. But only because the portfolio is doing more than owning an asset. It is enforcing a rule. The stock that traveled from $100 to $200 and back to $100 created no buy-and-hold return. The 50/50 system ended with $112.50 because it changed its exposure while the path unfolded. That does not mean volatility is money.
It means volatility, low correlation, disciplined sizing, and repeated rebalancing can interact in a way that changes compound growth. The edge is not guessing which asset moves next. It is designing a portfolio that knows what to do after something moves. Most investors own positions. The stronger system owns rules for how those positions are allowed to change. That is the real lesson behind Shannon's Demon: Return is not only where the market ends. It is what your system did on the way there.
Sources
- MIT News: Claude Shannon, founder of digital communications and information theory
- Jane Street: Quantitative Trader, New York — $300,000 base salary
- Jane Street: Quantitative Researcher, New York — $300,000 base salary
- MIT OpenCourseWare: Lecture 16, Portfolio Management
- Volatility Harvesting: Extracting Return from Randomness
- EDHEC: Measuring Volatility Pumping Benefits in Equity Markets
Educational material only. This article does not provide individualized investment advice or promise that rebalancing will improve returns.